
The majority of DBA’s perform health checks on their databases every now and then. Usually, it would happen on a daily or weekly basis. We previously discussed why such checks are important and what they should include.
To make sure your systems are in a good shape, you’d need to go through quite a lot of information - host statistics, MySQL statistics, workload statistics, state of backups, database packages, logs and so forth. Such data should be available in every properly monitored environment, although sometimes it is scattered across multiple locations - you may have one tool to monitor MySQL state, another tool to collect system statistics, maybe a set of scripts, e.g., to check the state of your backups. This makes health checks much more time-consuming than they should be - the DBA has to put together the different pieces to understand the state of the system.
Integrated tools like ClusterControl have an advantage that all of the bits are located in the same place (or in the same application). It still does not mean they are located next to each other - they may be located in different sections of the UI and a DBA may have to spend some time clicking through the UI to reach all the interesting data.
The whole idea behind creating Operational Reports is to put all of the most important data into a single document, which can be quickly reviewed to get an understanding of the state of the databases.
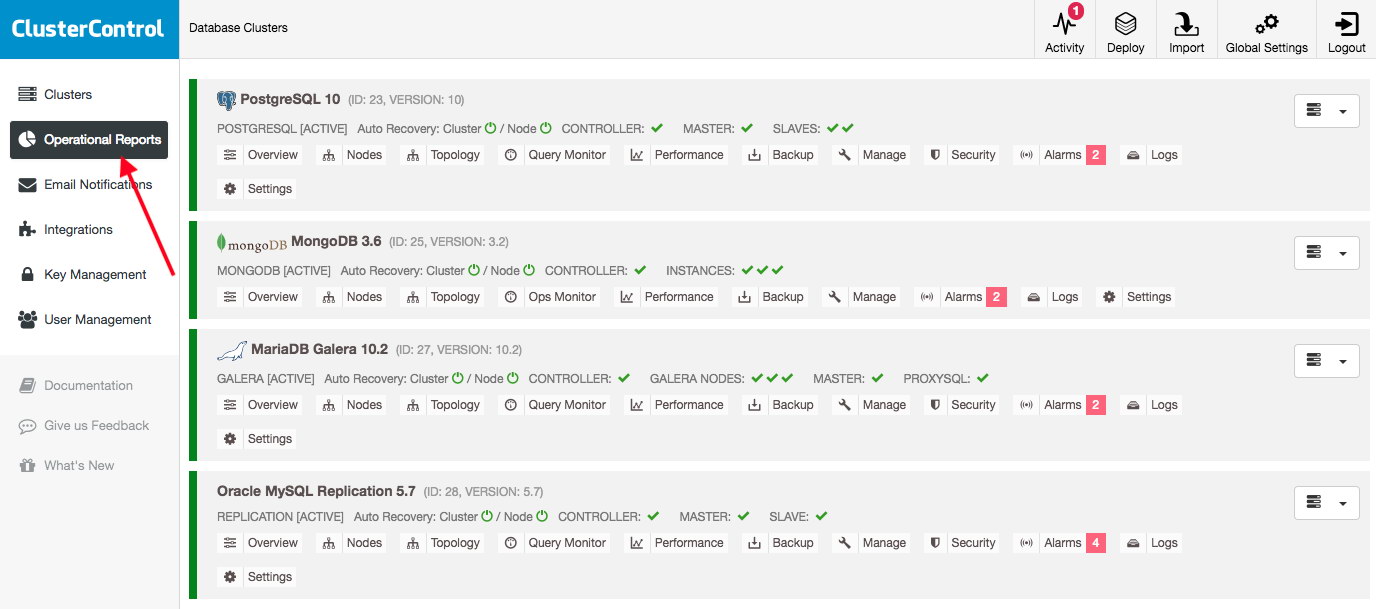
Operational Reports are available from the menu Side Menu -> Operational Reports:
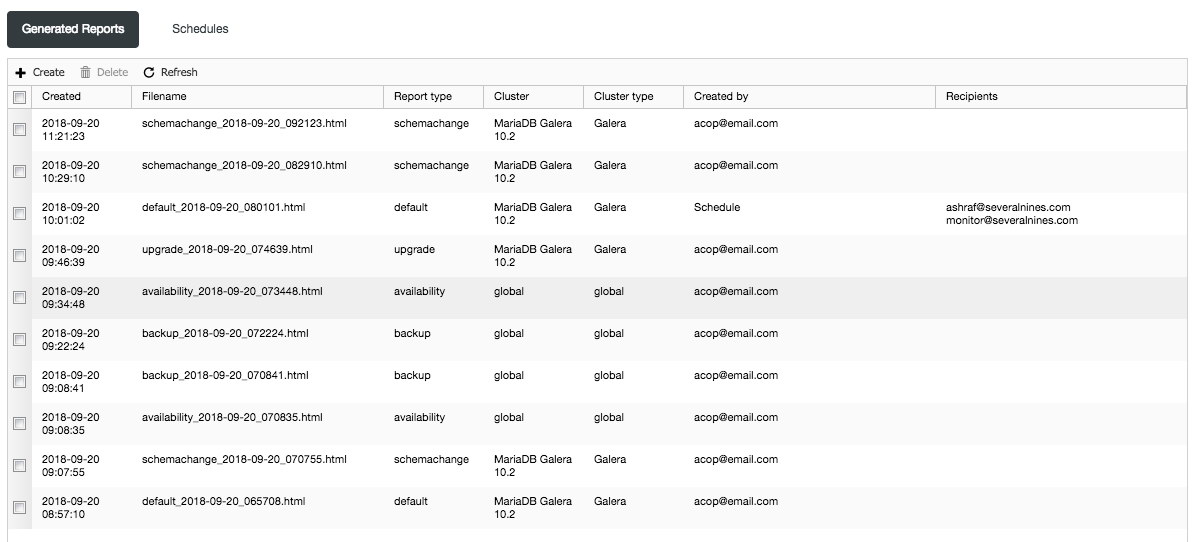
Once you go there, you’ll be presented with a list of reports created manually or automatically, based on a predefined schedule:
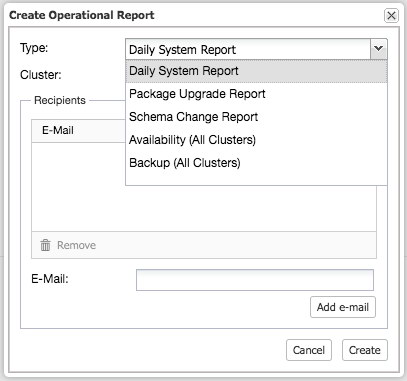
If you want to create a new report manually, you’ll use the 'Create' option. Pick the type of report, cluster name (for per-cluster report), email recipients (optional - if you want the report to be delivered to you), and you’re pretty much done:
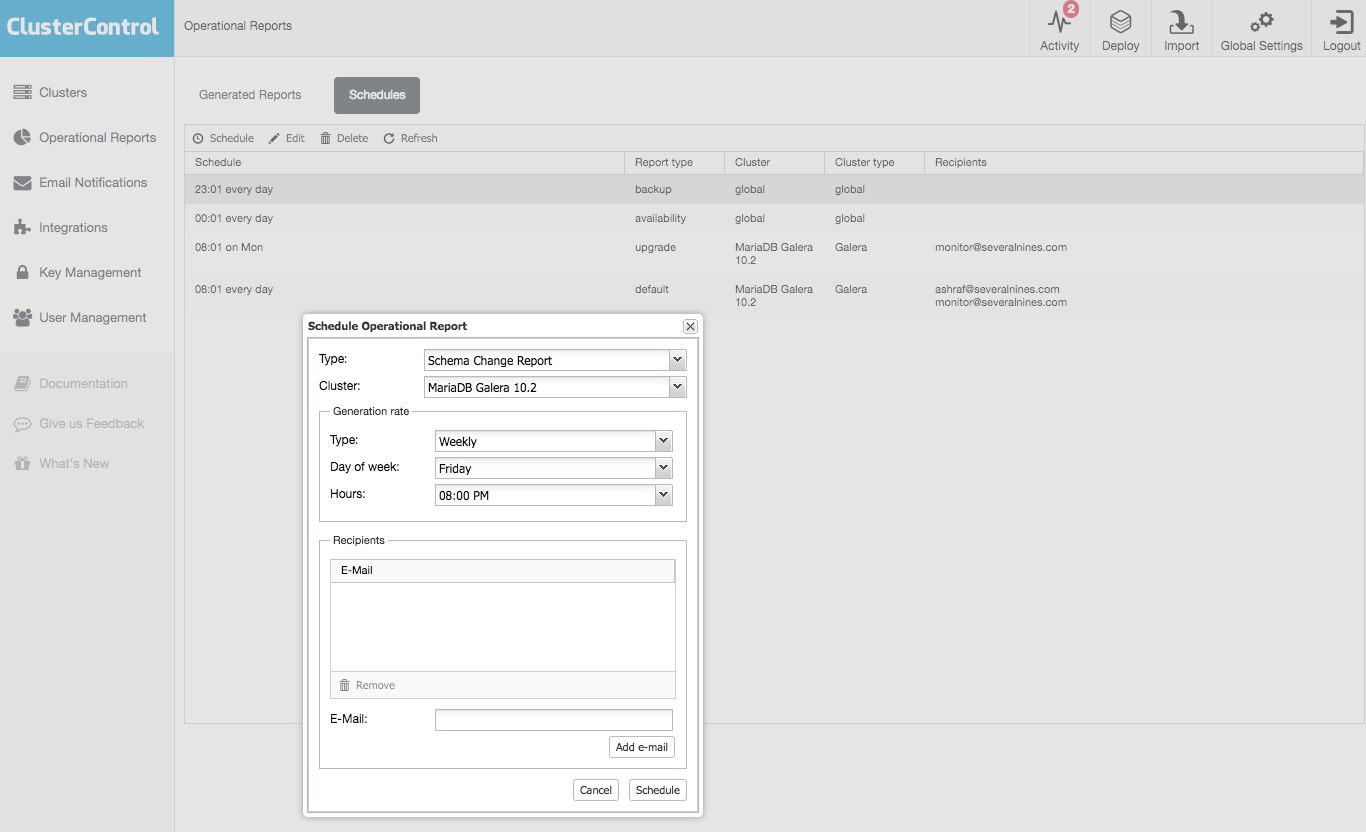
The reports can also be scheduled to be created on a regular basis:
At this time, 5 types of reports are available:
- Availability report - All clusters.
- Backup report - All clusters.
- Schema change report - MySQL/MariaDB-based cluster only.
- Daily system report - Per cluster.
- Package upgrade report - Per cluster.
Availability Report
Availability reports focuses on, well, availability. It includes three sections. First, availability summary:
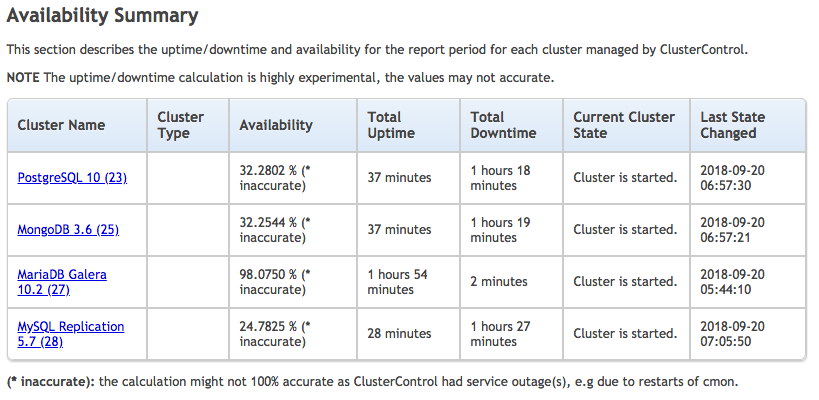
You can see information about availability statistics of your databases, the cluster type, total uptime and downtime, current state of the cluster and when that state last changed.
Another section gives more details on availability for every cluster. The screenshot below only shows one of the database cluster:
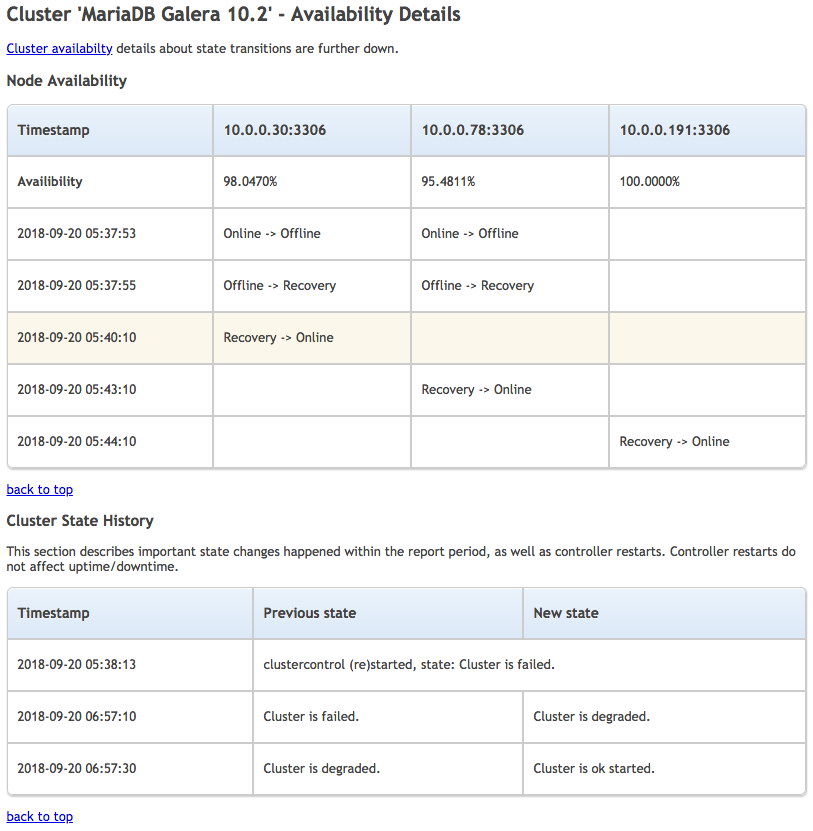
We can see when a node switched state and what the transition was. It’s a nice place to check if there were any recent problems with the cluster. Similar data is shown in the third section of this report, where you can go through the history of changes in cluster state.
Backup Report
The second type of the report is one covering backups of all clusters. It contains two sections - backup summary and backup details, where the former basically gives you a short summary of when the last backup was created, if it completed successfully or failed, backup verification status, success rate and retention period:
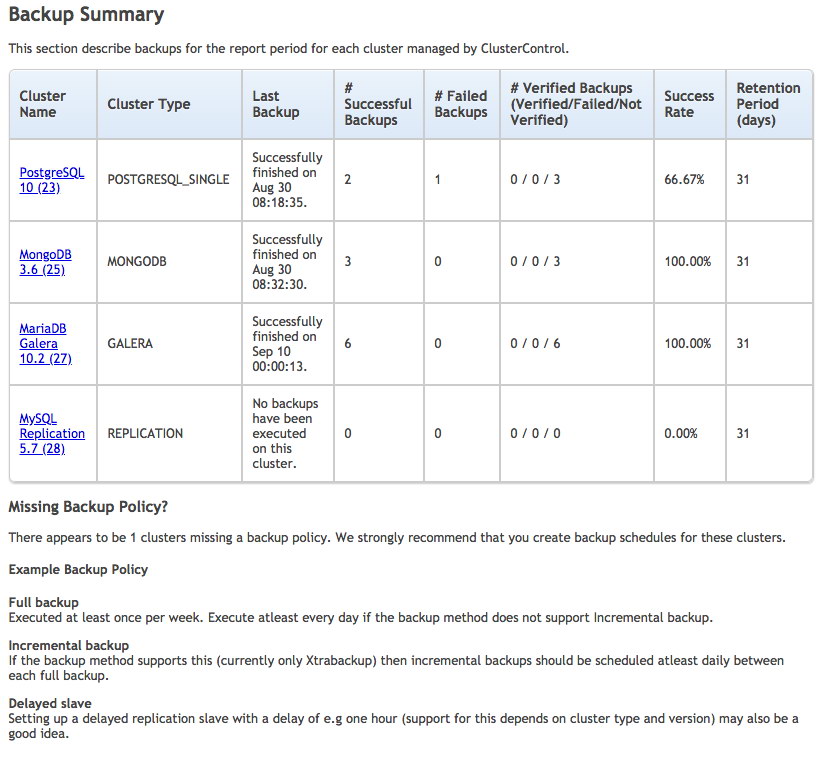
ClusterControl also provides examples of backup policy if it finds any of the monitored database cluster running without any scheduled backup or delayed slave configured. Next are the backup details:
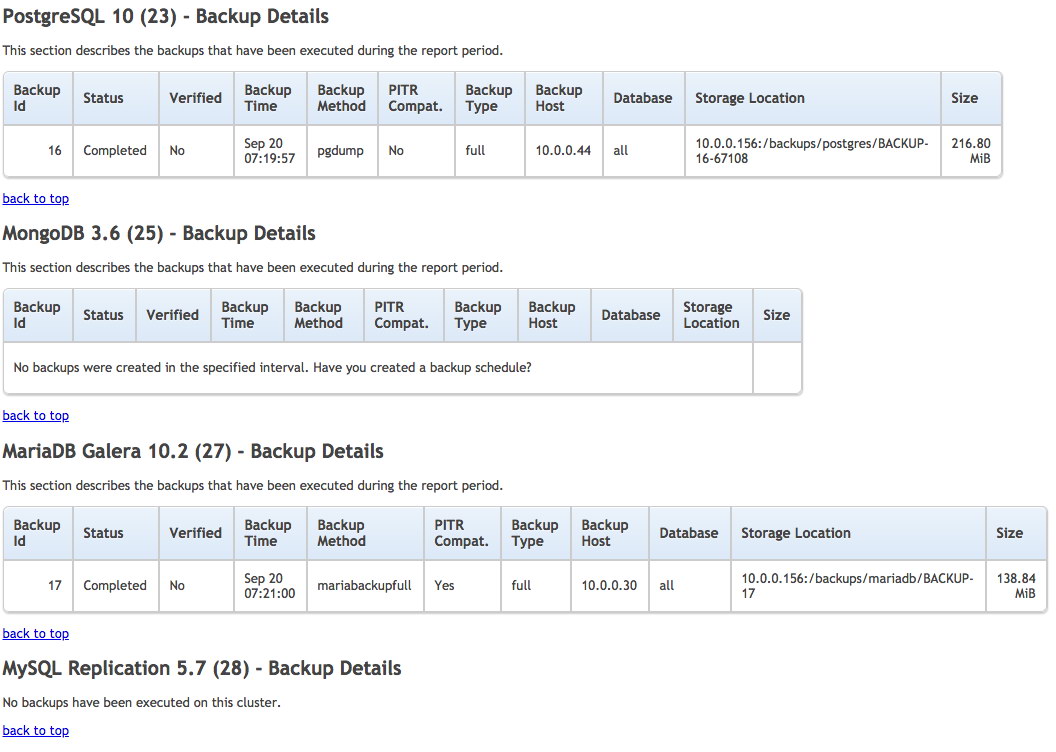
You can also check the list of backups executed on the cluster with their state, type and size within the specified interval. This is as close you can get to be certain that backups work correctly without running a full recovery test. We definitely recommend that such tests are performed every now and then. Good news is ClusterControl supports MySQL-based restoration and verification on a standalone host under Backup -> Restore Backup.
Daily System Report
This type of report contains detailed information about a particular cluster. It starts with a summary of different alerts which are related to the cluster:

Next section is about the state of the nodes that are part of the cluster:
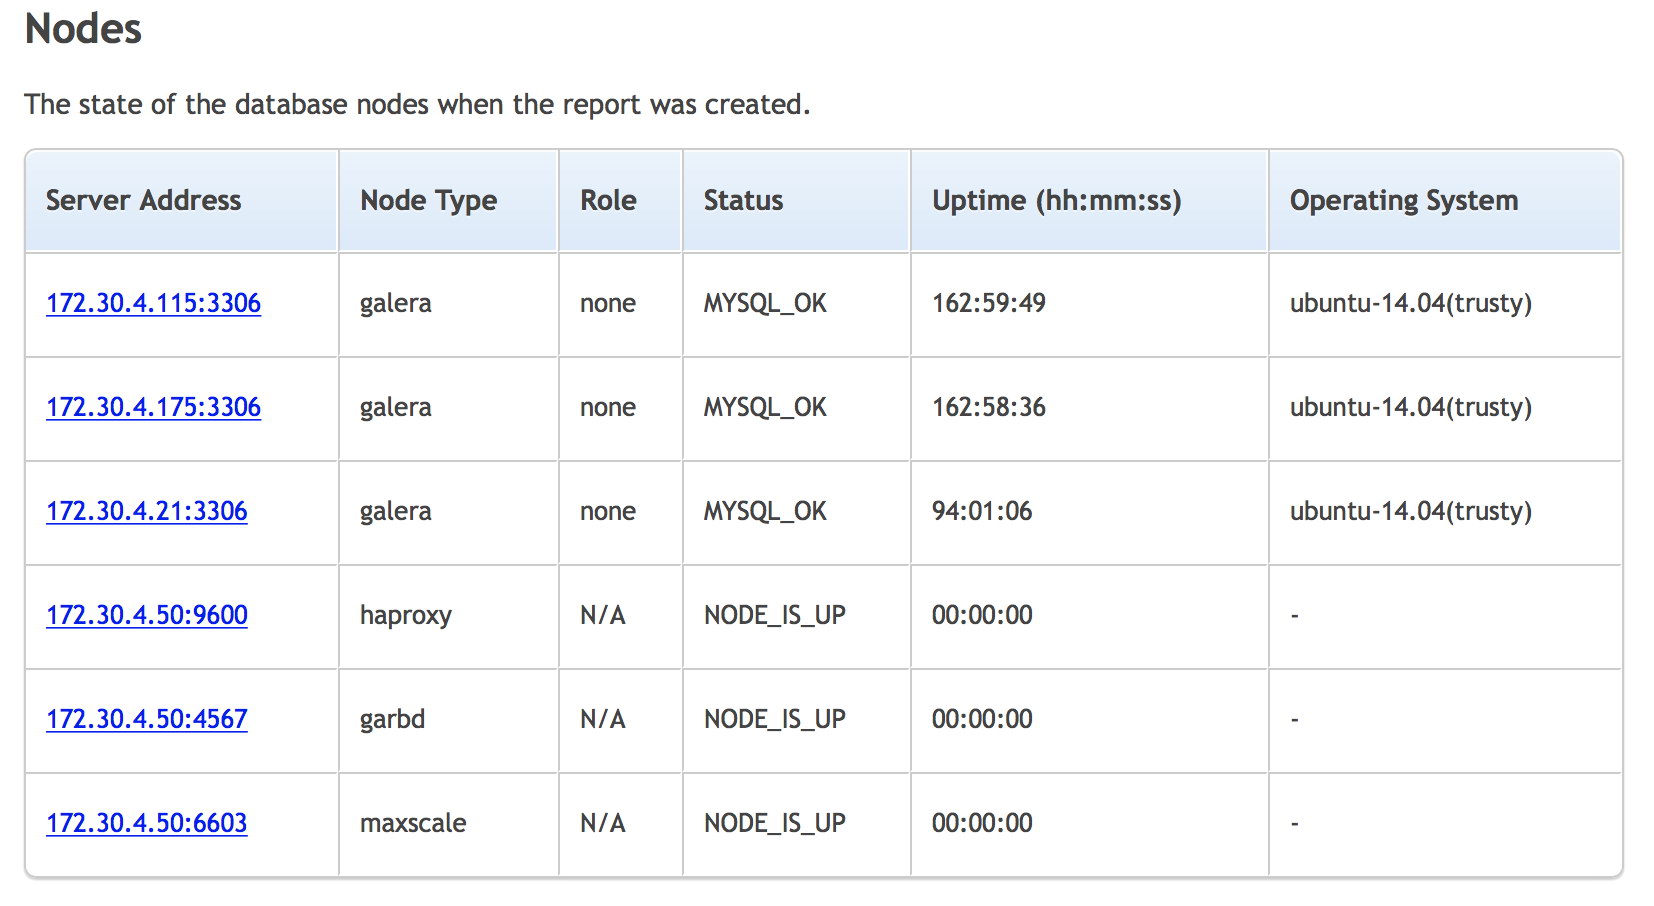
You have a list of the nodes in the cluster, their type, role (master or slave), status of the node, uptime and the OS.
Another section of the report is the backup summary, same as we discussed above. Next one presents a summary of top queries in the cluster:
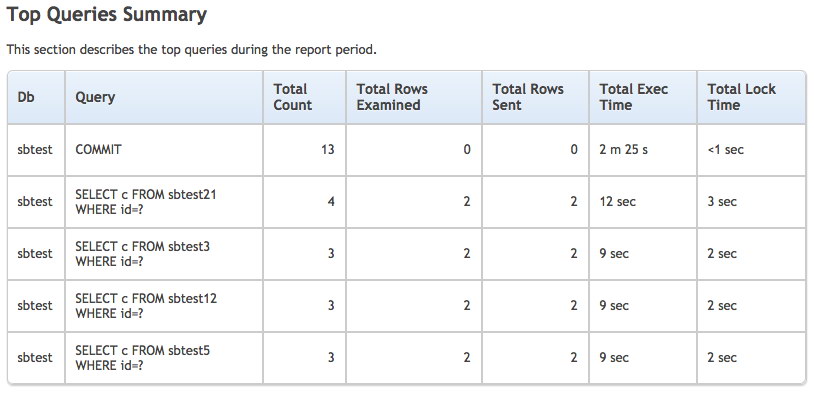
Finally, we see a “Node status overview” in which you’ll be presented with graphs related to OS and MySQL metrics for each node.
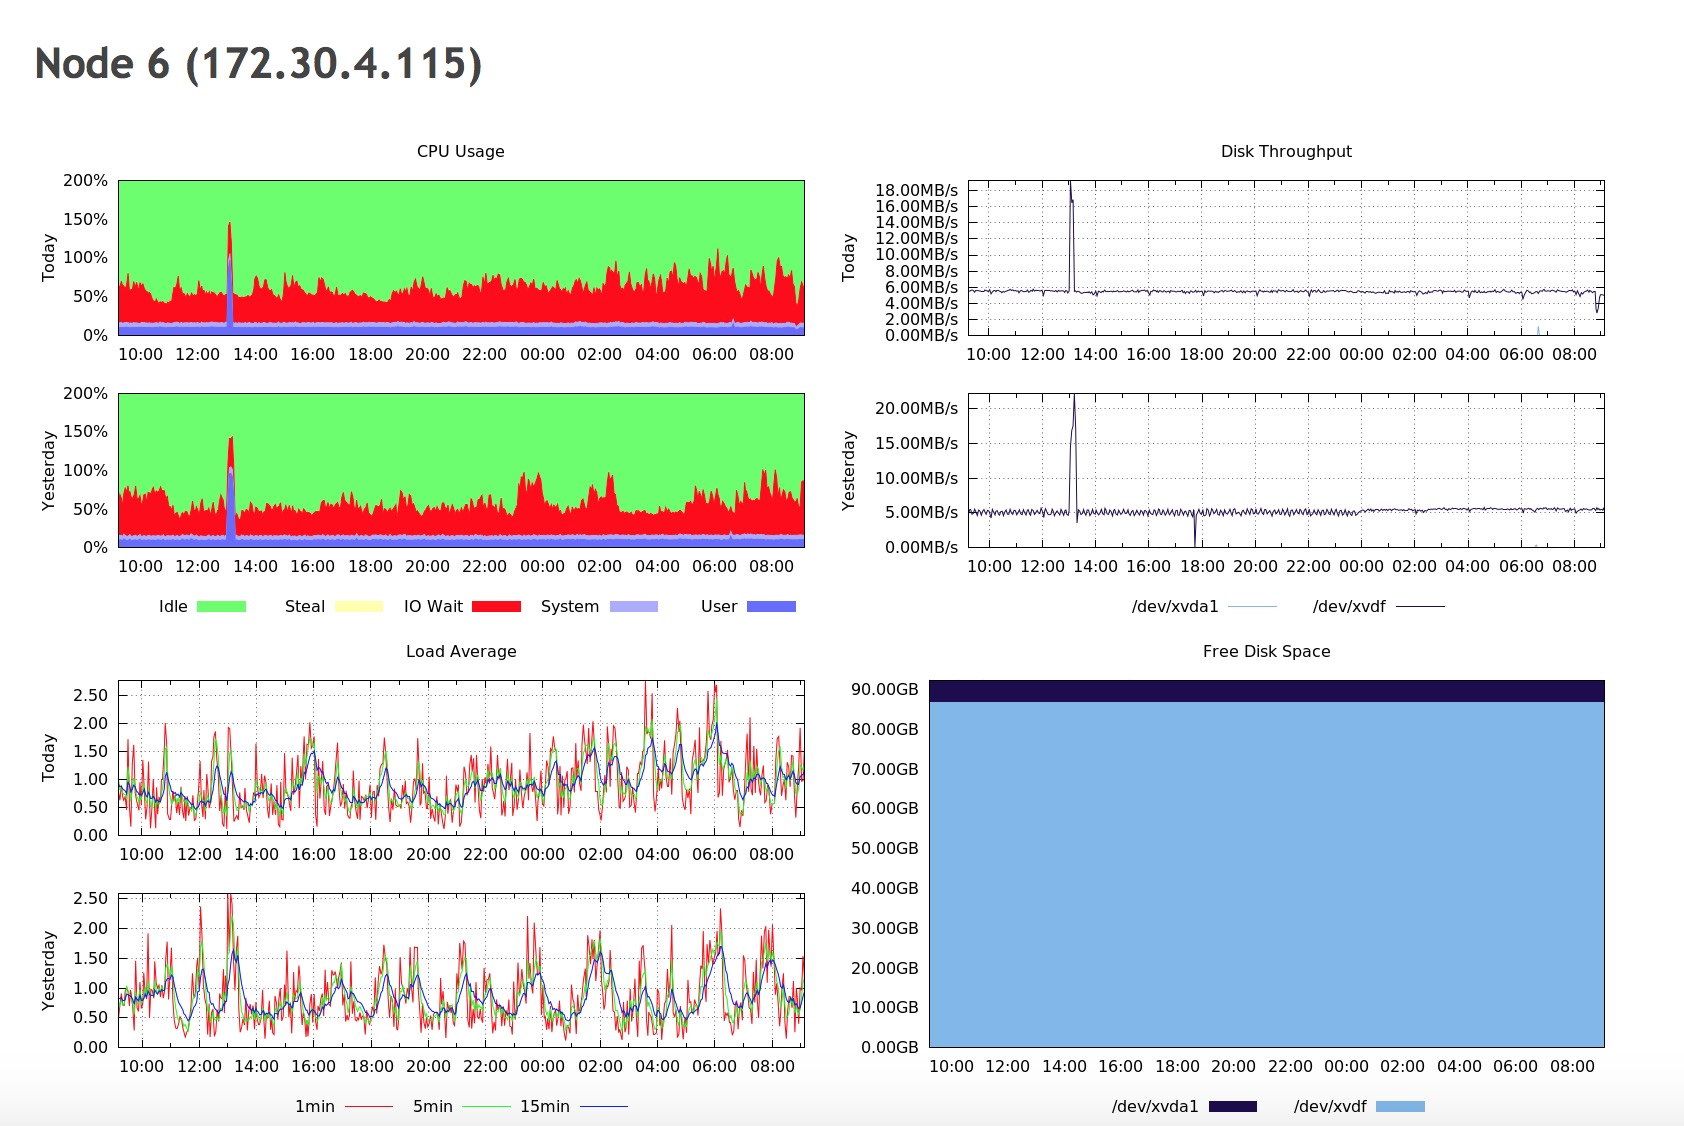
As you can see, we have here graphs covering all of the aspects of the load on the host - CPU, memory, network, disk, CPU load and disk free. This is enough to get an idea whether anything weird happened recently or not. You can also see some details about MySQL workload - how many queries were executed, which type of query, how the data was accessed (via which handler)? This, on the other hand, should be enough to pick most of the issues on MySQL side. What you want to look at are all spikes and dips that you haven’t seen in the past. Maybe a new query has been added to the mix and, as a result, handler_read_rnd_next skyrocketed? Maybe there was an increase of CPU load and a high number of connections might point to increased load on MySQL, but also to some kind of contention. An unexpected pattern might be good to investigate, so you know what is going on.
Package Upgrade Report
This report gives a summary of packages available for upgrade by the repository manager on the monitored hosts. For an accurate reporting, ensure you always use stable and trusted repositories on every host. In some undesirable occasions, the monitored hosts could be configured with an outdated repository after an upgrade (e.g, every MariaDB major version uses different repository), incomplete internal repository (e.g, partial mirrored from the upstream) or bleeding edge repository (commonly for unstable nightly-build packages).
The first section is the upgrade summary:
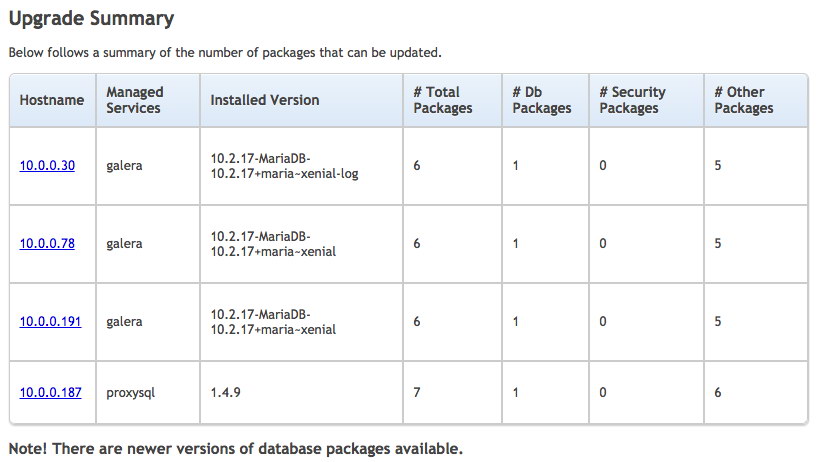
It summarizes the total number of packages available for upgrade as well as the related managed service for the cluster like load balancer, virtual IP address and arbitrator. Next, ClusterControl provides a detailed package list, grouped by package type for every host:
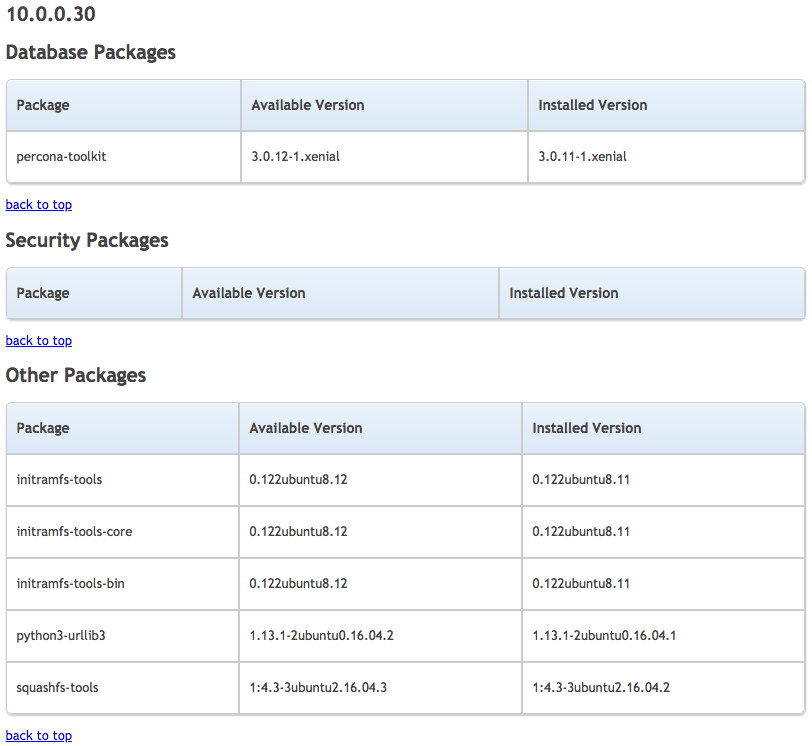
This report provides the available version and can greatly help us plan our maintenance window efficiently. For critical upgrades like security and database packages, we could prioritize it over non-critical upgrades, which could be consolidated with other less priority maintenance windows.
Schema Change Report
This report compares the selected MySQL/MariaDB database changes in table structure which happened between two different generated reports. In the MySQL/MariaDB older versions, DDL operation is a non-atomic operation (pre 8.0) and requires full table copy (pre 5.6 for most operations) - blocking other transactions until it completes. Schema changes could become a huge pain once your tables get a significant amount of data and must be carefully planned especially in a clustered setup. In a multi-tiered development environment, we have seen many cases where developers silently modify the table structure, resulting in significant impact to query performance.
In order for ClusterControl to produce an accurate report, special options must be configured inside CMON configuration file for the respective cluster:
- schema_change_detection_address - Checks will be executed using SHOW TABLES/SHOW CREATE TABLE to determine if the schema has changed. The checks are executed on the address specified and is of the format HOSTNAME:PORT. The schema_change_detection_databases must also be set. A differential of a changed table is created (using diff).
- schema_change_detection_databases - Comma separated list of databases to monitor for schema changes. If empty, no checks are made.
In this example, we would like to monitor schema changes for database "myapp" and "sbtest" on our MariaDB Cluster with cluster ID 27. Pick one of the database nodes as the value of schema_change_detection_address. For MySQL replication, this should be the master host, or any slave host that holds the databases (in case partial replication is active). Then, inside /etc/cmon.d/cmon_27.cnf, add the two following lines:
schema_change_detection_address=10.0.0.30:3306
schema_change_detection_databases=myapp,sbtest
Restart CMON service to load the change:
$ systemctl restart cmonFor the first and foremost report, ClusterControl only returns the result of metadata collection, similar to below:
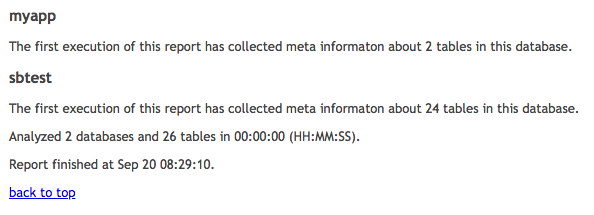
With the first report as the baseline, the subsequent reports will return the output that we are expecting for:
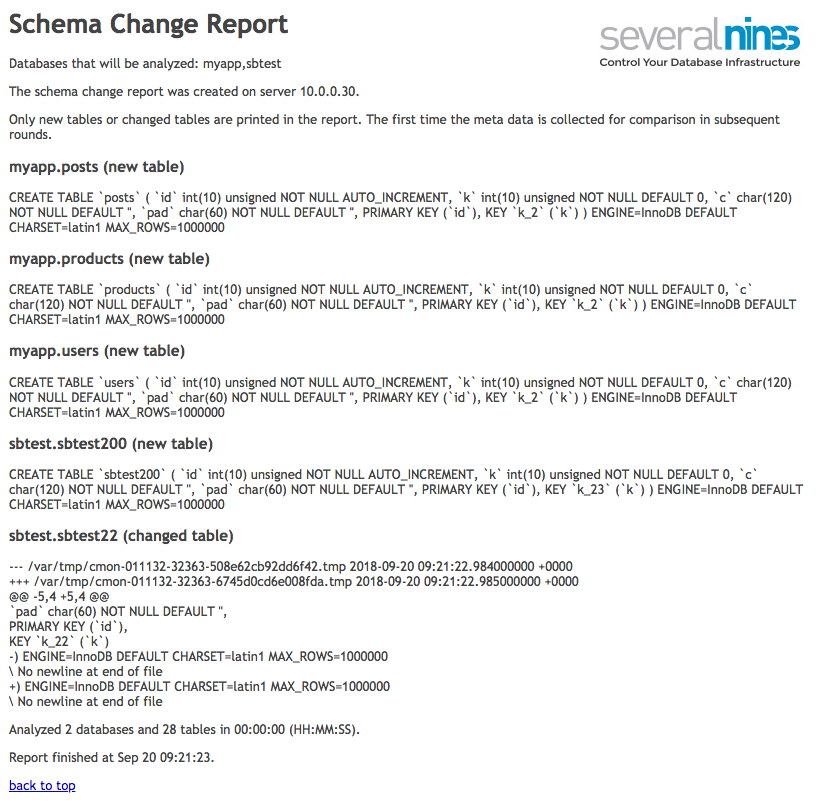
Take note only new tables or changed tables are printed in the report. The first report is only for metadata collection for comparison in the subsequent rounds, thus we have to run it for at least twice to see the difference.
With this report, you can now gather the database structure footprints and understand how your database has evolved across time.
Final Thoughts
Operational report is a comprehensive way to understand the state of your database infrastructure. It is built for both operational or managerial staff, and can be very useful in analysing your database operations. The reports can be generated in-place or can be delivered to you via email, which make things conveniently easy if you have a reporting silo.
We’d love to hear your feedback on anything else you’d like to have included in the report, what’s missing and what is not needed.