Quantcast
Channel: Severalnines - MongoDB
Viewing all 286 articles
Browse latest View live

Announcing ClusterControl 1.6 - automation and management of open source databases in the cloud

$
0
0

Today we are excited to announce the 1.6 release of ClusterControl - the all-inclusive database management system that lets you easily deploy, monitor, manage and scale highly available open source databases - and load balancers - in any environment: on-premise or in the cloud.

ClusterControl 1.6 introduces a new set of cloud features in BETA status that allow users to deploy and manage their open source database clusters on public clouds such AWS, Google Cloud and Azure. The release also provides a Point In Time Recovery functionality for MySQL/MariaDB systems, as well as new topology views for PostgreSQL Replication clusters, MongoDB ReplicaSets and Sharded clusters.

Release Highlights

Deploy and manage clusters on public Clouds (BETA)

  • Supported cloud providers: Amazon Web Services (VPC), Google Cloud, and Azure
  • Supported databases: MySQL/MariaDB Galera, Percona XtraDB Cluster, PostgreSQL, MongoDB ReplicaSet

Point In Time Recovery - PITR (MySQL)

  • Position and time-based recovery for MySQL based clusters

Enhanced Topology View

  • Support added for PostgreSQL Replication clusters; MongoDB ReplicaSets and Sharded clusters

Additional Highlights

  • Deploy multiple clusters in parallel and increase deployment speed
  • Enhanced Database User Management for MySQL/MariaDB based systems
  • Support for MongoDB 3.6
ClusterControl
Single Console for Your Entire Database Infrastructure
Find out what else is new in ClusterControl

View Release Details and Resources

Release Details

Deploy and manage open source database clusters on public Clouds (BETA)

With this latest release, we continue to add deeper cloud functionality to ClusterControl. Users can now launch cloud instances and deploy database clusters on AWS, Google Cloud and Azure right from their ClusterControl console; and they can now also upload/download backups to Azure cloud storage. Supported cloud providers currently include Amazon Web Services (VPC), Google Cloud, and Azure as well as the following databases: MySQL/MariaDB Galera, PostgreSQL, MongoDB ReplicaSet.

Point In Time Recovery - PITR (MySQL)

Point-in-Time recovery of MySQL & MariaDB involves restoring the database from backups prior to the target time, then uses incremental backups and binary logs to roll the database forward to the target time. Typically, database administrators use backups to recover from different types of cases such as a database upgrade that fails and corrupts the data or storage media failure/corruption. But what happens when an incident occurs at a time in between two backups? This is where binary logs come in: as they store all of the changes, users can also use them to replay traffic. ClusterControl automates that process for you and helps you minimize data loss after an outage.

New Topology View

The ClusterControl Topology View provides a visual representation of your database nodes and load balancers in real time, in a simple and friendly interface without the need to install any additional tools. Distributed databases or clusters typically consist of multiple nodes and node types, and it can be a challenge to understand how these work together. If you also have load balancers in the mix, hosts with multiple IP addresses and more, then the setup can quickly become too complex to visualise. That’s where the new ClusterControl Topology View comes in: it shows all the different nodes that form part of your database cluster (whether database nodes, load balancers or arbitrators), as well as the connections between them in an easy to view visual. With this release, we have added support for PostgreSQL Replication clusters as well as MongoDB ReplicaSets and Sharded clusters.

Enhanced Database User Management for MySQL based clusters

One important aspect of being a database administrator is to protect access to the company’s data. We have redesigned our DB User Management for MySQL based clusters with a more modern user interface, which makes it easier to view and manage the database accounts and privileges directly from ClusterControl.

Additional New Functionalities

  • Improved cluster deployment speed by utilizing parallel jobs. Deploy multiple clusters in parallel.
  • Support to deploy and manage MongoDB cluster on v3.6

Download ClusterControl today!

Happy Clustering!


How to Go Into Production With MongoDB - Top Ten Tips

$
0
0

After the successful development of the application and prior to dedicating yourself to the production of MongoDB, reckon with these quick guidelines in order to ensure a smooth and efficient flow as well as to achieve optimal performance.

1) Deployment Options

Selection of Right Hardware

For optimal performance, it’s preferable to use SSD rather than the HDD. It is necessary to take care whether your storage is local or remote and take measures accordingly. It’s better to use RAID for protection of hardware defects and recovery scheme, but don’t rely completely on it, as it doesn’t offer any protection against adverse failures. For execution on disks, RAID-10 is a good fit in terms of performance and availability which lacks often in other RAID levels. The right hardware is the building block for your application for optimized performance and to avoid any major debacle.

Cloud Hosting

A range of cloud vendors is available which offer pre-installed MongoDB database hosts. The selection of best choice is the founding step for your application to grow and make first impressions on the target market. MongoDB Atlas is one of the possible choices which offers a complete solution for cloud interface with features like deployment of your nodes and a snapshot of your data stored in Amazon S3. ClusterControl is another good available option for easy deployment and scaling. Which offers a variety of features like easy addition and removal of nodes, resize instances, and cloning of your production cluster. You can try ClusterControl here without being charged. Other available options are RackSpace ObjectRocket and MongoStitch.

2) RAM

Frequently accessed items are cached in RAM, so that MongoDB can provide optimal response time. RAM usually depends on the amount of data you are going to store, the number of collections, and indexes. Make sure you have enough RAM to accommodate your indexes otherwise it will drastically affect your application performance on production. More RAM means less page fault and better response time.

3) Indexing

For applications which include chronic write requests, indexing plays an imperative role. According to MongoDB docs:

“If a write operation modifies an indexed field, MongoDB updates all indexes that have the modified field as a key”

So, be careful while choosing indexes as it may affect your DB performance.

Indexing Example: Sample entry in the restaurant database

{
  "address": {
     "building": "701",
     "street": "Harley street",
     "zipcode": "71000"
  },
  "cuisine": "Bakery",
  "grades": [
     { "date": { "$date": 1393804800000 }, "grade": "A", "score": 2 },
     { "date": { "$date": 1378857600000 }, "grade": "A", "score": 6 },
     { "date": { "$date": 1358985600000 }, "grade": "A", "score": 10 },
     { "date": { "$date": 1322006400000 }, "grade": "A", "score": 9 },
     { "date": { "$date": 1299715200000 }, "grade": "B", "score": 14 }
  ],
  "name": "Bombay Bakery",
  "restaurant_id": "187521"
}
  1. Creating Index on Single Field

    > db.restaurants.createIndex( { "cuisine": 1 } );
    {
         "createdCollectionAutomatically" : false,
         "numIndexesBefore" : 1,
         "numIndexesAfter" : 2,
         "ok" : 1
    }

    In above example ascending order index is created on cuisine field.

  2. Creating Index on Multiple Fields

    > db.restaurants.createIndex( { "cuisine": 1 , "address.zipcode": -1 } );
    {
            "createdCollectionAutomatically" : false,
            "numIndexesBefore" : 2,
            "numIndexesAfter" : 3,
            "ok" : 1
    }

    Here compound index is created on cuisine and zip code fields. The -ve number defines descending order.

4) Be Prepared for Sharding

MongoDB partitions the data into different machines using a mechanism known as sharding. It is not advised to add sharding in the beginning unless you are expecting hefty datasets. Do remember to keep your application performance in line you need a good sharding key, according to your data patterns as it directly affects your response time. Balancing of data across shards is automatic. However, it’s better to be prepared and have a proper plan. So you can consolidate whenever your application demands.

5) Best practices for OS Configuration

  • XFS File System
    • It’s highly scalable, high performance 64-bit journaling file system. Revamps I/O performance by permitting fewer and larger I/O operations.
  • Put file descriptor limit.
  • Disable transparent huge pages and Nonuniform Access Memory (NUMA).
  • Change the default TCP keepalive time to 300 seconds (for Linux) and 120 seconds (for Azure).

Try these commands for changing default keepalive time;

For Linux

sudo sysctl -w net.ipv4.tcp_keepalive_time=<value>

For Windows

Type this command in Command Prompt as an Administrator, where <value> is expressed in hexadecimal (e.g. 120000 is 0x1d4c0):

reg add HKLM\SYSTEM\CurrentControlSet\Services\Tcpip\Parameters\ /t REG_DWORD /v KeepAliveTime /d <value>

6) Ensuring High Availability using Replication

Going on production without replication can cause your app sudden down failures. Replication takes care of the problem if a node fails. Manage read, write operations for your secondary MongoDB instances according to your application needs.

Keep these things in mind while Replicating:

  • For high availability, deploy your replica set into a minimum of three data centers.
  • Ensure that MongoDB instances have 0 or 1 votes.
  • Ensure full bi-directional network connectivity between all MongoDB instances.

Example of creating a replica set with 4 local MongoDB instances:

  1. Creating 4 local MongoDB instances

    First, create data directories

    mkdir -p /data/m0
    mkdir -p /data/m1
    mkdir -p /data/m2
    mkdir -p /data/m3
  2. Start 4 local instances

    mongod --replSet cluster1 --port 27017 --dbpath /data/m0
    mongod --replSet cluster2 --port 27018 --dbpath /data/m1
    mongod --replSet cluster1 --port 27019 --dbpath /data/m2
    mongod --replSet cluster1 --port 27020 --dbpath /data/m3
  3. Add the instances to the cluster and initiate

    mongo myhost:34014
    myConfig = {_id: ‘cluster1’, members: [
        {_id: 0, host: ‘myhost1:27017’},
        {_id: 1, host: ‘myhost2:27018’},
        {_id: 2, host: ‘myhost3:27019’},
        {_id: 3, host: ‘myhost4:27020’}]
    }
    rs.initiate(myConfig);

Security Measures

7) Secure Machines

Open ports on machines hosting MongoDB are vulnerable to various malicious attacks. More than 30 thousand MongoDB databases had been compromised in a ransomware attack due to lag in proper security configuration. While going on production close your public ports of MongoDB server. However, You should keep one port open for SSh purpose.

Enabling Authentication on MongoDB instance:

  1. Launch mongod.conf file in your favorite editor.

  2. Append these lines at the end of the config file.

    security:
          authorization: enabled
  3. Append these lines at the end of the config file.

    service mongod restart
  4. Confirm the status

    service mongod status

Restraining external access

Open mongod.conf file again to set limited IPs access your server.

bind_ip=127.0.0.1

By adding this line, it means you can only access your server through 127.0.0. (which is localhost). You can also add multiple IPs in bind option.

bind_ip=127.0.0.1,168.21.200.200

It means you can access from localhost and your private network.

8) Password Protection

To add an extra security layer to your machines enable access control and enforce authentication. Despite the fact that you have restrained MongoDB server to accept connections from the outside world, there is still a possibility of any malicious scripts to get into your server. So, don’t be reluctant to set a username/password for your database and assign required permissions. Enabled access control will allow users only to perform actions determined by their roles.

Here are the steps to create a user and assigning database access with specific roles.

In the first place we will create a user (in this case, it’s admin) for managing all users and databases and then we will create specific database owner having only read and write privileges on one MongoDB database instance.

Create an admin user for managing others users for database instances

  1. Open your Mongo shell and switch to the admin database:

    use admin
  2. Create a user for admin database

    db.createUser({ user: "admin", pwd: "admin_password", roles: [{ role: "userAdminAnyDatabase", db: "admin" }] })
  3. Authenticate newly created user

    db.auth("admin", "admin_password")
  4. Creating specific instance user:

    use database_1
    db.createUser({ user: "user_1", pwd: "your_password", roles: [{ role: "dbOwner", db: "database_1" }] })
  5. Now verify, if a user has been successfully created or not.

    db.auth("user_1", "your_password")
    show collections

That’s it! You have successfully secured your database instances with proper authentication. You can add as many users as you want following the same procedure.

9) Encryption and Protection of Data

If you are using Wiredtiger as a storage engine then you can use it’s encryption at rest configuration to encrypt your data. If not, then encryption should be performed on the host using a file system, devices or physical encryption.

10) Monitor Your Deployment

Once you have finished the deployment of MongoDB into production, then you must track the performance activity to prevent early possible problems. There is a range of strategies you can adapt to monitor your data performance in the production environment.

  • MongoDB includes utilities, which return statistics about instance performance and activity. Utilities are used to pinpoint issues and analyze normal operations.

  • Use mongostat to apprehend arrangement of operation types and capacity planning.

  • For tracking reports and read-write activities, mongotop is recommended.

mongotop 15

This command will return output after every 15 seconds.

                     ns    total    read    write          2018-04-22T15:32:01-05:00
   admin.system.roles      0ms     0ms      0ms
 admin.system.version      0ms     0ms      0ms
             local.me      0ms     0ms      0ms
       local.oplog.rs      0ms     0ms      0ms
   local.replset.minvalid  0ms     0ms      0ms
    local.startup_log      0ms     0ms      0ms
 local.system.indexes      0ms     0ms      0ms
  local.system.namespaces  0ms     0ms      0ms
 local.system.replset      0ms     0ms      0ms     
                     ns    total    read    write          2018-04-22T15:32:16-05:00
   admin.system.roles      0ms     0ms      0ms
 admin.system.version      0ms     0ms      0ms
             local.me      0ms     0ms      0ms
       local.oplog.rs      0ms     0ms      0ms
   local.replset.minvalid  0ms     0ms      0ms
    local.startup_log      0ms     0ms      0ms
 local.system.indexes      0ms     0ms      0ms
  local.system.namespaces  0ms     0ms      0ms
 local.system.replset      0ms     0ms      0ms

MongoDB Monitoring Service (MMS) is another available option that monitors your MongoDB cluster and makes it convenient for you to have a sight of production deployment activities.

And of course there is ClusterControl by Severalnines, the automation and management system for open source databases. ClusterControl enables easy deployment of clusters with automated security settings and makes it simple to troubleshoot your database by providing easy-to-use management automation that includes repair and recovery of broken nodes, automatic upgrades, and more. You can get started with its (free forever) Community Edition, with which you can deploy and monitor MongoDB as well as create custom advisors in order to tune your monitoring efforts to those aspects that are specific to your setup. Download it free here.

Deploying Cloud Databases with ClusterControl 1.6

$
0
0

ClusterControl 1.6 comes with tighter integration with AWS, Azure and Google Cloud, so it is now possible to launch new instances and deploy MySQL, MariaDB, MongoDB and PostgreSQL directly from the ClusterControl user interface. In this blog, we will show you how to deploy a cluster on Amazon Web Services.

Note that this new feature requires two modules called clustercontrol-cloud and clustercontrol-clud. The former is a helper daemon which extends CMON capability of cloud communication, while the latter is a file manager client to upload and download files on cloud instances. Both packages are dependencies of the clustercontrol UI package, which will be installed automatically if they do not exist. See the Components documentation page for details.

Cloud Credentials

ClusterControl allows you to store and manage your cloud credentials under Integrations (side menu) -> Cloud Providers:

The supported cloud platforms in this release are Amazon Web Services, Google Cloud Platform and Microsoft Azure. On this page, you can add new cloud credentials, manage existing ones and also connect to your cloud platform to manage resources.

The credentials that have been set up here can be used to:

  • Manage cloud resources
  • Deploy databases in the cloud
  • Upload backup to cloud storage

The following is what you would see if you clicked on "Manage AWS" button:

You can perform simple management tasks on your cloud instances. You can also check the VPC settings under "AWS VPC" tab, as shown in the following screenshot:

The above features are useful as reference, especially when preparing your cloud instances before you start the database deployments.

Database Deployment on Cloud

In previous versions of ClusterControl, database deployment on cloud would be treated similarly to deployment on standard hosts, where you had to create the cloud instances beforehand and then supply the instance details and credentials in the "Deploy Database Cluster" wizard. The deployment procedure was unaware of any extra functionality and flexibility in the cloud environment, like dynamic IP and hostname allocation, NAT-ed public IP address, storage elasticity, virtual private cloud network configuration and so on.

With version 1.6, you just need to supply the cloud credentials, which can be managed via the "Cloud Providers" interface and follow the "Deploy in the Cloud" deployment wizard. From ClusterControl UI, click Deploy and you will be presented with the following options:

At the moment, the supported cloud providers are the three big players - Amazon Web Service (AWS), Google Cloud and Microsoft Azure. We are going to integrate more providers in the future release.

In the first page, you will be presented with the Cluster Details options:

In this section, you would need to select the supported cluster type, MySQL Galera Cluster, MongoDB Replica Set or PostgreSQL Streaming Replication. The next step is to choose the supported vendor for the selected cluster type. At the moment, the following vendors and versions are supported:

  • MySQL Galera Cluster - Percona XtraDB Cluster 5.7, MariaDB 10.2
  • MongoDB Cluster - MongoDB 3.4 by MongoDB, Inc and Percona Server for MongoDB 3.4 by Percona (replica set only).
  • PostgreSQL Cluster - PostgreSQL 10.0 (streaming replication only).

In the next step, you will be presented with the following dialog:

Here you can configure the selected cluster type accordingly. Pick the number of nodes. The Cluster Name will be used as the instance tag, so you can easily recognize this deployment in your cloud provider dashboard. No space is allowed in the cluster name. My.cnf Template is the template configuration file that ClusterControl will use to deploy the cluster. It must be located under /usr/share/cmon/templates on the ClusterControl host. The rest of the fields are pretty self-explanatory.

The next dialog is to select the cloud credentials:

You can choose the existing cloud credentials or create a new one by clicking on the "Add New Credential" button. The next step is to choose the virtual machine configuration:

Most of the settings in this step are dynamically populated from the cloud provider by the chosen credentials. You can configure the operating system, instance size, VPC setting, storage type and size and also specify the SSH key location on the ClusterControl host. You can also let ClusterControl generate a new key specifically for these instances. When clicking on "Add New" button next to Virtual Private Cloud, you will be presented with a form to create a new VPC:

VPC is a logical network infrastructure you have within your cloud platform. You can configure your VPC by modifying its IP address range, create subnets, configure route tables, network gateways, and security settings. It's recommended to deploy your database infrastructure in this network for isolation, security and routing control.

When creating a new VPC, specify the VPC name and IPv4 address block with subnet. Then, choose whether IPv6 should be part of the network and the tenancy option. You can then use this virtual network for your database infrastructure.

ClusterControl
Single Console for Your Entire Database Infrastructure
Find out what else is new in ClusterControl

The last step is the deployment summary:

In this stage, you need to choose which subnet under the chosen virtual network that you want the database to be running on. Take note that the chosen subnet MUST have auto-assign public IPv4 address enabled. You can also create a new subnet under this VPC by clicking on "Add New Subnet" button. Verify if everything is correct and hit the "Deploy Cluster" button to start the deployment.

You can then monitor the progress by clicking on the Activity -> Jobs -> Create Cluster -> Full Job Details:

Depending on the connections, it could take 10 to 20 minutes to complete. Once done, you will see a new database cluster listed under the ClusterControl dashboard. For PostgreSQL streaming replication cluster, you might need to know the master and slave IP addresses once the deployment completes. Simply go to Nodes tab and you would see the public and private IP addresses on the node list on the left:

Your database cluster is now deployed and running on AWS.

At the moment, the scaling up works similar to the standard host, where you need to create a cloud instance manually beforehand and specify the host under ClusterControl -> pick the cluster -> Add Node.

Under the hood, the deployment process does the following:

  1. Create cloud instances
  2. Configure security groups and networking
  3. Verify the SSH connectivity from ClusterControl to all created instances
  4. Deploy database on every instance
  5. Configure the clustering or replication links
  6. Register the deployment into ClusterControl

Take note that this feature is still in beta. Nevertheless, you can use this feature to speed up your development and testing environment by controlling and managing the database cluster in different cloud providers from a single user interface.

Database Backup on Cloud

This feature has been around since ClusterControl 1.5.0, and now we added support for Azure Cloud Storage. This means that you can now upload and download the created backup on all three major cloud providers (AWS, GCP and Azure). The upload process happens right after the backup is successfully created (if you toggle "Upload Backup to the Cloud") or you can manually click on the cloud icon button of the backup list:

You can then download and restore backups from the cloud, in case you lost your local backup storage, or if you need to reduce local disk space usage for your backups.

Current Limitations

There are some known limitations for the cloud deployment feature, as stated below:

  • There is currently no 'accounting' in place for the cloud instances. You will need to manually remove the cloud instances if you remove a database cluster.
  • You cannot add or remove a node automatically with cloud instances.
  • You cannot deploy a load balancer automatically with a cloud instance.

We have extensively tested the feature in many environments and setups but there are always corner cases that we might have missed out upon. For more information, please take a look at the change log.

Happy clustering in the cloud!

Updated: Become a ClusterControl DBA: Safeguarding your Data

$
0
0

In the past four posts of the blog series, we covered deployment of clustering/replication (MySQL/Galera, MySQL Replication, MongoDB & PostgreSQL), management & monitoring of your existing databases and clusters, performance monitoring and health and in the last post, how to make your setup highly available through HAProxy and ProxySQL.

So now that you have your databases up and running and highly available, how do you ensure that you have backups of your data?

You can use backups for multiple things: disaster recovery, to provide production data to test against development or even to provision a slave node. This last case is already covered by ClusterControl. When you add a new (replica) node to your replication setup, ClusterControl will make a backup/snapshot of the master node and use it to build the replica. It can also use an existing backup to stage the replica, in case you want to avoid that extra load on the master. After the backup has been extracted, prepared and the database is up and running, ClusterControl will automatically set up replication.

Creating an Instant Backup

In essence, creating a backup is the same for Galera, MySQL replication, PostgreSQL and MongoDB. You can find the backup section under ClusterControl > Backup and by default you would see a list of created backup of the cluster (if any). Otherwise, you would see a placeholder to create a backup:

From here you can click on the "Create Backup" button to make an instant backup or schedule a new backup:

All created backups can also be uploaded to cloud by toggling "Upload Backup to the Cloud", provided you supply working cloud credentials. By default, all backups older than 31 days will be deleted (configurable via Backup Retention settings) or you can choose to keep it forever or define a custom period.

"Create Backup" and "Schedule Backup" share similar options except the scheduling part and incremental backup options for the latter. Therefore, we are going to look into Create Backup feature (a.k.a instant backup) in more depth.

As all these various databases have different backup tools, there is obviously some difference in the options you can choose. For instance with MySQL you get to choose between mysqldump and xtrabackup (full and incremental). For MongoDB, ClusterControl supports mongodump and mongodb-consistent-backup (beta) while PostgreSQL, pg_dump and pg_basebackup are supported. If in doubt which one to choose for MySQL, check out this blog about the differences and use cases for mysqldump and xtrabackup.

Backing up MySQL and Galera

As mentioned in the previous paragraph, you can make MySQL backups using either mysqldump or xtrabackup (full or incremental). In the "Create Backup" wizard, you can choose which host you want to run the backup on, the location where you want to store the backup files, and its directory and specific schemas (xtrabackup) or schemas and tables (mysqldump).

If the node you are backing up is receiving (production) traffic, and you are afraid the extra disk writes will become intrusive, it is advised to send the backups to the ClusterControl host by choosing "Store on Controller" option. This will cause the backup to stream the files over the network to the ClusterControl host and you have to make sure there is enough space available on this node and the streaming port is opened on the ClusterControl host.

There are also several other options whether you would want to use compression and the compression level. The higher the compression level is, the smaller the backup size will be. However, it requires higher CPU usage for the compression and decompression process.

If you would choose xtrabackup as the method for the backup, it would open up extra options: desync, backup locks, compression and xtrabackup parallel threads/gzip. The desync option is only applicable to desync a node from a Galera cluster. Backup locks uses a new MDL lock type to block updates to non-transactional tables and DDL statements for all tables which is more efficient for InnoDB-specific workload. If you are running on Galera Cluster, enabling this option is recommended.

After scheduling an instant backup you can keep track of the progress of the backup job in the Activity > Jobs:

After it has finished, you should be able to see the a new entry under the backup list.

Backing up PostgreSQL

Similar to the instant backups of MySQL, you can run a backup on your Postgres database. With Postgres backups there are two backup methods supported - pg_dumpall or pg_basebackup. Take note that ClusterControl will always perform a full backup regardless of the chosen backup method.

We have covered this aspect in this details in Become a PostgreSQL DBA - Logical & Physical PostgreSQL Backups.

Backing up MongoDB

For MongoDB, ClusterControl supports the standard mongodump and mongodb-consistent-backup developed by Percona. The latter is still in beta version which provides cluster-consistent point-in-time backups of MongoDB suitable for sharded cluster setups. As the sharded MongoDB cluster consists of multiple replica sets, a config replica set and shard servers, it is very difficult to make a consistent backup using only mongodump.

Note that in the wizard, you don't have to pick a database node to be backed up. ClusterControl will automatically pick the healthiest secondary replica as the backup node. Otherwise, the primary will be selected. When the backup is running, the selected backup node will be locked until the backup process completes.

Scheduling Backups

Now that we have played around with creating instant backups, we now can extend that by scheduling the backups.

The scheduling is very easy to do: you can select on which days the backup has to be made and at what time it needs to run.

For xtrabackup there is an additional feature: incremental backups. An incremental backup will only backup the data that changed since the last backup. Of course, the incremental backups are useless if there would not be full backup as a starting point. Between two full backups, you can have as many incremental backups as you like. But restoring them will take longer.

Once scheduled the job(s) should become visible under the "Scheduled Backup" tab and you can edit them by clicking on the "Edit" button. Like with the instant backups, these jobs will schedule the creation of a backup and you can keep track of the progress via the Activity tab.

Backup List

You can find the Backup List under ClusterControl > Backup and this will give you a cluster level overview of all backups made. Clicking on each entry will expand the row and expose more information about the backup:

Each backup is accompanied with a backup log when ClusterControl executed the job, which is available under "More Actions" button.

Offsite Backup in Cloud

Since we have now a lot of backups stored on either the database hosts or the ClusterControl host, we also want to ensure they don’t get lost in case we face a total infrastructure outage. (e.g. DC on fire or flooded) Therefore ClusterControl allows you to store or copy your backups offsite on cloud. The supported cloud platforms are Amazon S3, Google Cloud Storage and Azure Cloud Storage.

The upload process happens right after the backup is successfully created (if you toggle "Upload Backup to the Cloud") or you can manually click on the cloud icon button of the backup list:

Choose the cloud credential and specify the backup location accordingly:

Restore and/or Verify Backup

From the Backup List interface, you can directly restore a backup to a host in the cluster by clicking on the "Restore" button for the particular backup or click on the "Restore Backup" button:

One nice feature is that it is able to restore a node or cluster using the full and incremental backups as it will keep track of the last full backup made and start the incremental backup from there. Then it will group a full backup together with all incremental backups till the next full backup. This allows you to restore starting from the full backup and applying the incremental backups on top of it.

ClusterControl supports restore on an existing database node or restore and verify on a new standalone host:

These two options are pretty similar, except the verify one has extra options for the new host information. If you follow the restoration wizard, you will need to specify a new host. If "Install Database Software" is enabled, ClusterControl will remove any existing MySQL installation on the target host and reinstall the database software with the same version as the existing MySQL server.

Once the backup is restored and verified, you will receive a notification on the restoration status and the node will be shut down automatically.

Point-in-Time Recovery

For MySQL, both xtrabackup and mysqldump can be used to perform point-in-time recovery and also to provision a new replication slave for master-slave replication or Galera Cluster. A mysqldump PITR-compatible backup contains one single dump file, with GTID info, binlog file and position. Thus, only the database node that produces binary log will have the "PITR compatible" option available:

When PITR compatible option is toggled, the database and table fields are greyed out since ClusterControl will always perform a full backup against all databases, events, triggers and routines of the target MySQL server.

Now restoring the backup. If the backup is compatible with PITR, an option will be presented to perform a Point-In-Time Recovery. You will have two options for that - “Time Based” and “Position Based”. For “Time Based”, you can just pass the day and time. For “Position Based”, you can pass the exact position to where you want to restore. It is a more precise way to restore, although you might need to get the binlog position using the mysqlbinlog utility. More details about point in time recovery can be found in this blog.

Backup Encryption

Universally, ClusterControl supports backup encryption for MySQL, MongoDB and PostgreSQL. Backups are encrypted at rest using AES-256 CBC algorithm. An auto generated key will be stored in the cluster's configuration file under /etc/cmon.d/cmon_X.cnf (where X is the cluster ID):

$ sudo grep backup_encryption_key /etc/cmon.d/cmon_1.cnf
backup_encryption_key='JevKc23MUIsiWLf2gJWq/IQ1BssGSM9wdVLb+gRGUv0='

If the backup destination is not local, the backup files are transferred in encrypted format. This feature complements the offsite backup on cloud, where we do not have full access to the underlying storage system.

Final Thoughts

We showed you how to get your data backed up and how to store them safely off site. Recovery is always a different thing. ClusterControl can recover automatically your databases from the backups made in the past that are stored on premises or copied back from the cloud.

Obviously there is more to securing your data, especially on the side of securing your connections. We will cover this in the next blog post!

MongoDB Chain Replication Basics

$
0
0

What is Chain Replication?

When we talk about replication, we are referring to the process of making redundant copies of data in order to meet design criteria on data availability. Chain replication, therefore, refers to the linear ordering of MongoDB servers to form a synchronized chain. The chain contains a primary node, succeeded by secondary servers arranged linearly. Like the word chain suggest, the server closest to the primary server replicates from it while every other succeeding secondary server replicates from the preceding secondary MongoDB server. This is the main difference between chained replication and normal replication. Chained replication occurs when a secondary node selects its target using ping time or when the closest node is a secondary. Although chain replication as it appears, reduces load on the primary node, it may cause replication lag.

Why Use Chain Replication?

System infrastructures sometimes suffer unpredictable failures leading to loss of a server and therefore affecting availability. Replication ensures that unpredictable failures do not affect availability. Replication further allows recovery from hardware failure and service interruption. Both chained and unchained replication serve this purpose of ensuring availability despite system failures. Having established that replication is important, you may ask why use chain replication in particular. There is no performance difference between chained and unchained replication in MongoDb. In both cases, when the primary node fails, the secondary servers vote for a new acting primary and therefore writing and reading of data is not affected in both cases. Chained replication is however the default replication type in MongoDb.

How to Setup a Chain Replica

By default, chained replication is enabled in MongoDB. We will therefore elaborate on the process of deactivating chain replication. The major reason for which chain replication can be disabled is if it is causing lag. The merit of chain replication is however superior to the lag demerit and therefore in most cases deactivating it is unnecessary. Just in case chain replication is not active by default, the following commands will help you activate.

cfg = rs.config()
cfg.settings.chainingAllowed = true
rs.reconfig(cfg)

This process is reversible. When forced to deactivate chain replication, the following process is followed religiously.

cfg = rs.config()
cfg.settings.chainingAllowed = false
rs.reconfig(cfg)
ClusterControl
Single Console for Your Entire Database Infrastructure
Find out what else is new in ClusterControl

Tips & Tricks for Chain Replication

The most dreadful limitations of chain replication is replication lag. Replication lag refers to the delay that occurs between the time when an operation is done on the primary and when the same operation is replicated on the secondary. Although it is naturally impossible, it is always desired that the speed of replication to be very high in that replication lag is zero. To avoid or minimize replication lag to be close to zero, it a prudent design criteria to use primary and secondary hosts of the same specs in terms of CPU, RAM, IO and network related specs.

Although chain replication ensures data availability, chain replication can be used together with journaling. Journaling provides data safety by writing to a log that is regularly flushed to disk. When the two are combined three servers are written per write request unlike in chain replication alone where only two servers are written per write request.

Another important tip is using w with replication. The w parameter controls the number of servers that a response should be written to before returning success. When the w parameter is set, the getlasterror checks the servers’ oplog and waits until the given number of ‘w’ servers have the operation applied.

Using a monitoring tool like MongoDB Monitoring Service (MMS) or ClusterControl allows you to obtain the status of your replica nodes and visualize changes over time. For instance, in MMS, you can find replica lag graphs of the secondary nodes showing the variation in replication lag time.

Measuring Chain Replication Performance

By now you are aware that the most important performance parameter of chain replication is the replication lag time. We will therefore discuss how to test for replication lag period. This test can be done through the MongoDb shell script. To do a replication lag test, we compare the oplog of the last event on the primary node and the oplog of last event on the secondary node.

To check the information for the primary node, we run the following code.

db.printSlaveReplicationInfo()

The above command will provide information on all the recent operations on the primary node.The results should appear as below.

rs-ds046297:PRIMARY db.printSlaveReplicationInfo()
source: ds046297-a1.mongolab.com:46297
synced To: Tue Mar 05 2013 07:48:19 GMT-0800 (PST)
      = 7475 secs ago (2.08hrs)
source: ds046297-a2.mongolab.com:46297
synced To: Tue Mar 05 2013 07:48:19 GMT-0800 (PST)
      = 7475 secs ago (2.08hrs)

Having obtained the oplog for the primary, we are now interested in the oplog for the secondary node. The following command will help us obtain the oplog.

db.printReplicationInfo()

This command will provide an output with details on oplog size, log length, time for oplog first event, time for oplog last event and the current time. The results appear as below.

rs-ds046297:PRIMARY db.printReplicationInfo()
configured oplog size:   1024MB
log length start to end: 5589 secs (1.55hrs)
oplog first event time:  Tue Mar 05 2013 06:15:19 GMT-0800 (PST)
oplog last event time:   Tue Mar 05 2013 07:48:19 GMT-0800 (PST)
now:                     Tue Mar 05 2013 09:53:07 GMT-0800 (PST)

From the oplog of the primary server, the last sync occurred on Tue Mar 05 2013 07:48:19 GMT-0800 (PST). From the oplog of the secondary server, the last operation occurred on Tue Mar 05 2013 07:48:19 GMT-0800 (PST). The replication lag was zero and therefore our chain replicated system is in correct operation. Replication time lag may however vary depending on the amount of changes that need to be replicated.

Optimizing Your Linux Environment for MongoDB

$
0
0

MongoDB performance depends on how it utilizes the underlying resources. It stores data on disk, as well as in memory. It uses CPU resources to perform operations, and a network to communicate with its clients. There should be adequate resources to support its general liveliness. In this article we are going to discuss various resource requirements for the MongoDB database system and how we can optimize them for maximum performance.

Requirements for MongoDB

Apart from providing large-scale resources such as the RAM and CPU to the database, tuning the Operating System can also improve performance to some extent. The significant utilities required for establishing a MongoDB environment include:

  1. Enough disk space
  2. Adequate memory
  3. Excellent network connection.

The most common operating system for MongoDB is Linux, so we’ll look at how to optimize it for the database.

Reboot Condition.

There are many tuning techniques that can be applied to Linux. However, as some changes take place without rebooting your host, it is always a good practice to reboot after making changes to ensure they are applied. In this section, the tuning implementations we are going to discuss are:

  1. Network Stack
  2. NTP Daemon
  3. Linux User Limit
  4. File system and Options
  5. Security
  6. Virtual Memory

Network Stack

Like any other software, an excellent network connection provides a better exchange interface for requests and responses with the server. However, MongoDB is not favored with the Linux default kernel network tunings. As the name depicts, this is an arrangement of many layers that can be categorized into 3 main ones: User area, Kernel area and Device area. The user area and kernel area are referred to as host since their tasks are carried out by the CPU. The device area is responsible for sending and receiving packets through an interface called Network Interface Card. For better performance with the MongoDB environment, the host should be confined to a 1Gbps network interface limit. In this case, what we are supposed to tune is the relatively throughput settings which include:

  1. net.core.somaxconn (increase the value)
  2. net.ipv4.tcp_max_syn_backlog (increase the value)
  3. net.ipv4.tcp_fin_timeout (reduce the value)
  4. net.ipv4.tcp_keepalive_intvl (reduce the value)
  5. net.ipv4.tcp_keepalive_time (reduce the value)

To make these changes permanent, create a new file /etc/sysctl.d/mongodb-sysctl.conf if it does not exist and add these lines to it.

net.core.somaxconn = 4096
net.ipv4.tcp_fin_timeout = 30
net.ipv4.tcp_keepalive_intvl = 30
net.ipv4.tcp_keepalive_time = 120
net.ipv4.tcp_max_syn_backlog = 4096

Then run the command as root user /sbin/sysctl -p in order to apply the changes permanently.

NTP Daemon

Network Time Protocol (NTP) is a technique for which a software clock of a Linux system is synchronized with internet time servers. MongoDB, being a cluster, is dependent on time consistency across nodes. For this reason, it is important for the NTP to be run permanently on MongoDB hosts. The importance of the NTP configuration is to ensure continuous serving of the server to some set time after a network disconnection. By default, the NTP is installed on the client side so for MongoDB to install the NTP on a Linux system with Debian/Ubuntu flavor, just run the command:

$ sudo apt-get install ntp

You can visit ntp.conf to see the configuration of the NTP daemon for different OS.

Linux User Limit

Sometimes a user side fault can end up impacting the entire server and host system. To shun this, the Linux system is designed to undertake some system resource limits regarding processes being executed on a per-user basis. This being evident, it will be inappropriate to deploy MongoDB on such default system configurations since it would require more resources than the default provision. Besides, MongoDB is often the main process to utilize the underlying hardware, therefore, it will be predominant to optimize the Linux system for such dedicated usage. ThE database can then fully exploit the available resources.

However, it will not be convenient to disable this limit constraints or set them to an unlimited state. For example, if you run into a shortage of CPU storage or RAM, a small fault can escalate into a huge problem and result into other features to fail - e.g., SSH which is vital in solving the initial problem.

In order to achieve better estimations, you should understand the constraints requirements at the database level. For instance, estimating the number of users that will make requests to the database and processing time. You can refer to Key things to Monitor for MongoDB. A most preferable limit for max-user-processes and open-files are 64000. To set these values create a new file if it does not exist as /etc/security/limits.d and add these lines

mongod       soft        nofile       64000
mongod       hard        nofile       64000
mongod       soft        nproc        64000
mongod       hard        nproc        64000

For you to apply this changes, restart your mongod since the changes apply only to new shells.

File System and Options

MongoDB employs 3 type of filesystems that is, ext3, ext4, and XFS for on-disk database data. For the WiredTiger storage engine employed for MongoDB version greater than 3, the XFS is best used rather than ext4 which is considered to create some stability issues while ext3 is also avoided due to its poor pre-allocation performance. MongoDB does not use the default filesystem technique of performing an access-time metadata update like other systems. You can therefore disable access-time updates to save on the small amount of disk IO activity utilized by these updates.

This can be done by adding a flag noatime to the file system options field in the file etc/fstab for the disk serving MongoDB data.

$ grep "/var/lib/mongo" /proc/mounts
/dev/mapper/data-mongodb /var/lib/mongo ext4 rw, seclabel, noatime, data=ordered 0 0

This change can only be realized when your reboot or restart your MongoDB.

Security

Among the several security features a Linux system has, at kernel-level is the Security-Enhanced Linux. This is an implementation of fine-grained Mandatory Access Control. It provides a bridge to the security policy to determine whether an operation should proceed. Unfortunately, many Linux users set this access control module to warn only or they disable it totally. This is often due to some associated setbacks such as unexpected permission denied error. This module, as much as many people ignore it, plays a major role in reducing local attacks to the server. With this feature enabled and the correspondent modes set to positive, it will provide a secure background for your MongoDB. Therefore, you should enable the SELinux mode and also apply the Enforcing mode especially at the beginning of your installation. To change the SELinux mode to Enforcing: run the command

$ sudo setenforce Enforcing

You can check the running SELinux mode by running

$ sudo getenforce
Severalnines
 
Become a MongoDB DBA - Bringing MongoDB to Production
Learn about what you need to know to deploy, monitor, manage and scale MongoDB

Virtual Memory

Dirty ratio

MongoDB employs the cache technology to enhance quick fetching of data. In this case, dirty pages are created and some memory will be required to hold them. Dirty ratio therefore becomes the percentage of the total system memory that can hold dirty pages. In most cases, the default values are between (25 - 35)%. If this value is surpassed, then the pages are committed to disk and have an effect of creating a hard pause. To avoid this, you can set the kernel to always flush data through another ratio referred to as dirty_background_ratio whose value ranges between (10% - 15%) to disk in the background without necessarily creating the hard pause.

The aim here is to ensure quality query performance. You can therefore reduce the background ratio if your database system will require large memory. If a hard pause is allowed, you might end up having data duplicates or some data may fail to be recorded during that time. You can also reduce the cache size to avoid data being written to disk in small batches frequently that may end up increasing the disk throughput. To check the currently running value you can run this command:

$ sysctl -a | egrep “vm.dirty.*_ratio”

and you will be presented with something like this.

vm.dirty_background_ratio = 10
vm.dirty_ratio = 20

Swappiness

It is a value ranging from 1 to 100 for which the Virtual Memory manager behaviour can be influenced from. Setting it to 100 implies to swap forcefully to disk and set it to 0 directs the kernel to swap only to shun out-of-memory problems. The default range for Linux is 50 - 60 of which is not appropriate for database systems. In my own test, setting the value between 0 to 10 is optimal. You can always set this value in the /etc/sysctl.conf

vm.swappiness = 5

You can then check this value by running the command

$ sysctl vm.swappiness

For you to apply these changes run the command /sbin/sysctl -p or you can reboot your system.

ChatOps - Managing MySQL, MongoDB & PostgreSQL from Slack

$
0
0

What is ChatOps?

Nowadays, we make use of multiple communication channels to manage or receive information from our systems, such as email, chat and applications among others. If we could centralize this in one or just a few different possible applications, and even better, if we could integrate it with tools that we currently use in our organization, we would be able to automate processes, improve our work dynamics and communication, having a clearer picture of the current state of our system. In many companies, Slack or other collaboration tools is becoming the centre and the heart of the development and ops teams.

What is ChatBot?

A chatbot is a program that simulates a conversation, receiving entries made by the user and returns answers based on its programming.

Some products have been developed with this technology, that allow us to perform administrative tasks, or keeps the team up to date on the current status of the systems.

This allows, among other things, to integrate the communication tools we use daily, with our systems.

CCBot - ClusterControl

CCBot is a chatbot that uses the ClusterControl APIs to manage and monitor your database clusters. You will be able to deploy new clusters or replication setups, keep your team up to date on the status of the databases as well as the status of any administrative jobs (e.g., backups or rolling upgrades). You can also restart failed nodes, add new ones, promote a slave to master, add load balancers, and so on. CCBot supports most of the major chat services like Slack, Flowdock and Hipchat.

CCBot is integrated with the s9s command line, so you have several commands to use with this tool.

ClusterControl Notifications via Slack

Note that you can use Slack to handle alarms and notifications from ClusterControl. Why? A chat room is a good place to discuss incidents. Seeing an actual alarm in a Slack channel makes it easy to discuss it with the team, because all team members actually know what is being discussed and can chime in.

The main difference between CCBot and the integration of notifications via Slack is that, with CCBot, the user initiates the communication via a specific command, generating a response from the system. For notifications, ClusterControl generates an event, for example, a message about a node failure. This event is then sent to the tool that we have integrated for our notifications, for example, Slack.

You can review this post on how to configure ClusterControl in order to send notifications to Slack.

After this, we can see ClusterControl notifications in our Slack:

ClusterControl Slack Integration

CCBot Installation

To install CCBot, once we have installed ClusterControl, we must execute the following script:

$ /var/www/html/clustercontrol/app/tools/install-ccbot.sh

We select which adapter we want to use, in this blog, we will select Slack.

-- Supported Hubot Adapters --
1. slack
2. hipchat
3. flowdock
Select the hubot adapter to install [1-3]: 1

It will then ask us for some information, such as an email, a description, the name we will give to our bot, the port, the API token and the channel to which we want to add it.

? Owner (User <user@example.com>)
? Description (A simple helpful robot for your Company)
Enter your bot's name (ccbot):
Enter hubot's http events listening port (8081):
Enter your slack API token:
Enter your slack message room (general):

To obtain the API token, we must go to our Slack -> Apps (On the left side of our Slack window), we look for Hubot and select Install.

CCBot Hubot
CCBot Hubot

We enter the Username, which must match our bot name.

In the next window, we can see the API token to use.

CCBot API Token
CCBot API Token
Enter your slack API token: xoxb-111111111111-XXXXXXXXXXXXXXXXXXXXXXXX
CCBot installation completed!

Finally, to be able to use all the s9s command line functions with CCBot, we must create a user from ClusterControl:

$ s9s user --create --cmon-user=cmon --group=admins  --controller="https://localhost:9501" --generate-key cmon

For further information about how to manage users, please check the official documentation.

We can now use our CCBot from Slack.

Here we have some examples of commands:

$ s9s --help
CCBot Help
CCBot Help

With this command we can see the help for the s9s CLI.

$ s9s cluster --list --long
CCBot Cluster List
CCBot Cluster List

With this command we can see a list of our clusters.

$ s9s cluster --cluster-id=17 --stat
CCBot Cluster Stat
CCBot Cluster Stat

With this command we can see the stats of one cluster, in this case cluster id 17.

$ s9s node --list --long
CCBot Node List
CCBot Node List

With this command we can see a list of our nodes.

$ s9s job --list
CCBot Job List
CCBot Job List

With this command we can see a list of our jobs.

$ s9s backup --create --backup-method=mysqldump --cluster-id=16 --nodes=192.168.100.34:3306 --backup-directory=/backup
CCBot Backup
CCBot Backup

With this command we can create a backup with mysqldump, in the node 192.168.100.34. The backup will be saved in the /backup directory.

ClusterControl
Single Console for Your Entire Database Infrastructure
Find out what else is new in ClusterControl

Now let's see some more complex examples:

$ s9s cluster --create --cluster-type=mysqlreplication --nodes="mysql1;mysql2" --vendor="percona" --provider-version="5.7" --template="my.cnf.repl57" --db-admin="root" --db-admin-passwd="root123" --os-user="root" --cluster-name="MySQL1"
CCBot Create Replication

With this command we can create a MySQL Master-Slave Replication with Percona for MySQL 5.7 version.

CCBot Check Replication Created

And we can check this new cluster.

In ClusterControl Topology View, we can check our current topology with one master and one slave node.

Topology View Replication 1
$ s9s cluster --add-node --nodes=mysql3 --cluster-id=24
CCBot Add Node
CCBot Add Node

With this command we can add a new slave in our current cluster.

Topology View Replication 2

And we can check our new topology in ClusterControl Topology View.

$ s9s cluster --add-node --cluster-id=24 --nodes="proxysql://proxysql"
CCBot Add ProxySQL
CCBot Add ProxySQL

With this command we can add a new ProxySQL node named "proxysql" in our current cluster.

Topology View Replication 3

And we can check our new topology in ClusterControl Topology View.

You can check the list of available commands in the documentation.
If we try to use CCBot from a Slack channel, we must add "@ccbot_name" at the beginning of our command:

@ccbot s9s backup --create --backup-method=xtrabackupfull --cluster-id=1 --nodes=10.0.0.5:3306 --backup-directory=/storage/backups

CCBot makes it easier for teams to manage their clusters in a collaborative way. It is fully integrated with the tools they use on a daily basis.

Note

If we have the following error when wanting to run the CCBot installer in our ClusterControl:

-bash: yo: command not found

We must update the version of nodejs package.

Conclusion

As we said previously, there are several ChatBot alternatives for different purposes, we can even create our own ChatBot, but as this technology facilitates our tasks and has several advantages that we mentioned at the beginning of this blog, not everything that shines is gold.

There is a very important detail to keep in mind - security. We must be very careful when using them, and take all the necessary precautions to know what we allow to do, in what way, at what moment, to whom and from where.

Decoding the MongoDB Error Logs

$
0
0

Sometimes decoding MongoDB error logs can be tricky and can consume big chunks of your valuable time. In this article, we will learn how to examine the MongoDB error logs by dissecting each part of the log messages.

Common Format for MongoDB Log Lines

Here is the log line pattern for version 3.0 and above...

<timestamp> <severity> <component> [<context>] <message>

Log line pattern for previous versions of MongoDB only included:

<timestamp> [<context>] <message>

Let’s look at each tag.

Timestamps

Timestamp field of log message stores the exact time when a log message was inserted in the log file. There are 4 types of timestamps supported by MongoDB. The default format is: iso8601-local. You can change it using --timeStampFormat parameter.

Timestamp Format NameExample
iso8601-local1969-12-31T19:00:00.000+0500
iso8601-utc1970-01-01T00:00:00.000Z
ctimeWed Dec 31 19:00:00.000
ctime-no-msWed Dec 31 19:00:00

Severity

The following table describes the meaning of all possible severity levels.

Severity LevelDescription
FFatal- The database error has caused the database to no longer be accessible
EError - Database errors which will stop DB execution.
WWarning - Database messages which explains potentially harmful behaviour of DB.
IInformational - Messages just for information purpose like ‘A new connection accepted’.
DDebug - Mostly useful for debugging the DB errors

Component

After version 3.0, log messages now include “component” to provide a functional categorization of the messages. This allows you to easily narrow down your search by looking at the specific components.

ComponentError Description
AccessRelated to access control
CommandRelated to database commands
ControlRelated to control activities
FTDCRelated to diagnostic data collection activities
GeoRelated to parsing geospatial shapes
IndexRelated to indexing operations
NetworkRelated to network activities
QueryRelated to queries
REPLRelated to replica sets
REPL_HBRelated to replica sets heartbeats
RollbackRelated to rollback db operations
ShardingRelated to sharding
StorageRelated to storage activities
JournalRelated to journal activities
WriteRelated to db write operations

Context

Context part of the error message generally contains the thread or connection id. Other values can be initandlisten. This part is surrounded by square brackets. Log messages of any new connection to MongoDB will have context value as initandlisten, for all other log messages, it will be either thread id or connection id. For e.g

2018-05-29T19:06:29.731+0000 [initandlisten] connection accepted from 127.0.0.1:27017 #1000 (13 connections now open)
2018-05-29T19:06:35.770+0000 [conn1000] end connection 127.0.0.1:27017 (12 connections now open)

Message

Contains the actual log message.

Log File Location

The default location on the server is: /var/log/mongodb/mongodb.log

If log file is not present at this location then you can check in the MongoDB config file. You can find MongoDB config file at either of these two locations.

/etc/mongod.conf or /yourMongoDBpath/mongod.conf

Once you open the config file, search for logpath option in it. logpath option tells MongoDB where to log all the messages.

Analyzing a Simple Log Message

Here is an example of a typical MongoDB error message...

2014-11-03T18:28:32.450-0500 I NETWORK [initandlisten] waiting for connections on port 27017

Timestamp: 2014-11-03T18:28:32.450-0500
Severity: I
Component: NETWORK
Context: [initandlisten]
Message: waiting for connections on port 27017

The most important part of this error is the message portion. In most of the cases, you can figure out the error by looking at this field. Sometimes if the message is not clear to you, then you can go for the component part. For this message, Component’s value is Network which means the log message is related to a network issue.

If you are not able to resolve your error, you can check the severity of the log message which says this message is for informational purpose. Further, you can also check out other parts of the log message like timestamp or context to find the complete root cause.

ClusterControl
Single Console for Your Entire Database Infrastructure
Find out what else is new in ClusterControl

Decoding Common Error Log Messages

  1. Message:

    2018-05-10T21:19:46.942 I CONTROL  [initandlisten] ** WARNING: Access control is not enabled for the database.

    Resolution: Create admin user in authentication database

  2. Message:

    2018-05-10T21:19:46.942 E COMMAND  [initandlisten] ** ERROR: getMore command failed. Cursor not found

    Resolution: Remove the timeout from the cursor or increase the cursor batch size.

  3. Message:

    2018-05-10T21:19:46.942 E INDEX  [initandlisten] ** ERROR:E11000 duplicate key error index: test.collection.$a.b_1 dup key: { : null }

    Resolution: Violation of unique key constraint. Try to insert document with different key.

  4. Message:

    2018-05-10T21:19:46.942 E NETWORK  [initandlisten] ** ERROR:Timed out connecting to localhost:27017.

    Resolution: Latency between the driver and the server is too great, the driver may give up. You can change setting by adding connectionTimeout option in connection string.

  5. Message:

    2018-05-10T21:19:46.942 E WRITE  [initandlisten] ** ERROR: A write operation resulted in an error. E11000 duplicate key error index: test.people.$_id_ dup key: { : 0 }

    Resolution: Remove duplication of _id field value from conflicting documents.

  6. Message:

    2018-05-10T21:19:46.942 E NETWORK  [initandlisten] ** ERROR: No connection could be made because the target machine actively refused it 127.0.0.1:27017 at System.Net.Sockets.Socket.EndConnect

    Resolution: Either server is not running on port 27017 or try to restart the server with correct host and port.

Log Management Tools

MongoDB 3.0 has updated its logging features to provide better insights for all database activities. There are many log management tools available in the market like MongoDB Ops Manager, log entries, mtools etc.

Conclusion

Logging is as important as Replication or Sharding for good and proper database management. For better database management, one should be able to decode the logs easily to rectify the exceptions/errors quickly. I hope that after reading this tutorial, you will feel more comfortable while analyzing complex MongoDB logs.


How to Optimize Performance of MongoDB

$
0
0

Excellent database performance is important when you are developing applications with MongoDB. Sometimes the overall data serving process may become degraded due to a number of reasons, some of which include:

  • Inappropriate schema design patterns
  • Improper use of or no use of indexing strategies
  • Inadequate hardware
  • Replication lag
  • Poorly performing querying techniques

Some of these setbacks might force you to increase hardware resources while others may not. For instance, poor query structures may result in the query taking a long time to be processed, causing replica lag and maybe even some data loss. In this case, one may think that maybe the storage memory is not enough, and that it probably needs scaling up. This article discusses the most appropriate procedures you can employ to boost the performance of your MongoDB database.

Schema Design

Basically the two most commonly employed schema relationships are...

  • One-to-Few
  • One-to-Many

While the most efficient schema design is the One-to-Many relationship, each has got its own merits and limitations.

One-to-Few

In this case, for a given field, there are embedded documents but they are not indexed with object identity.

Here is a simple example:

{
      userName: "Brian Henry",
      Email : "example@gmail.com",
      grades: [
             {subject: ‘Mathematics’,  grade: ‘A’},
             {subject: English,  grade: ‘B’},
      ]
}

One advantage of using this relationship is that you can get the embedded documents with just a single query. However, from a querying standpoint, you cannot access a single embedded document. So if you are not going to reference embedded documents separately, it will be optimal to use this schema design.

One-to-Many

For this relationship data in one database is related to data in a different database. For example, you can have a database for users and another for posts. So if a user makes a post it is recorded with user id.

Users schema

{ 
    Full_name: “John Doh”,
    User_id: 1518787459607.0
}

Posts schema

{
    "_id" : ObjectId("5aa136f0789cf124388c1955"),
    "postTime" : "16:13",
    "postDate" : "8/3/2018",
    "postOwnerNames" : "John Doh",
    "postOwner" : 1518787459607.0,
    "postId" : "1520514800139"
}

The advantage with this schema design is that the documents are considered as standalone (can be selected separately). Another advantage is that this design enables users of different ids to share information from the posts schema (hence the name One-to-Many) and sometimes can be “N-to-N” schema - basically without using table join. The limitation with this schema design is that you have to do at least two queries to fetch or select data in the second collection.

How to model the data will therefore depend on the application’s access pattern. Besides this you need to consider the schema design we have discussed above.

Optimization Techniques for Schema Design

  1. Employ document embedding as much as possible as it reduces the number of queries you need to run for a particular set of data.

  2. Don’t use denormalization for documents that are frequently updated. If anfield is going to be frequently updated, then there will be the task of finding all the instances that need to be updated. This will result in slow query processing, hence overwhelming even the merits associated with denormalization.

  3. If there is a need to fetch a document separately, then there is no need to use embedding since complex queries such as aggregate pipelining take more time to execute.

  4. If the array of documents to be embedded is large enough, don’t embed them. The array growth should at least have a bound limit.

Proper Indexing

This is the more critical part of performance tuning and requires one to have a comprehensive understanding on the application queries, ratio of reads to writes, and how much free memory your system has. If you use an index, then the query will scan the index and not the collection.

An excellent index is one that involves all the fields scanned by a query. This is referred to as a compound index.

To create a single index for a fields you can use this code:

db.collection.createIndex({“fields”: 1})

For a compound index, to create the indexing:

db.collection.createIndex({“filed1”: 1, “field2”:  1})

Besides faster querying by use of indexing, there is an addition advantage of other operations such as sort, samples and limit. For example, if I design my schema as {f: 1, m:1} i can do an additional operation apart from find as

db.collection.find( {f: 1} ).sort( {m: 1} )

Reading data from RAM is more efficient that reading the same data from disk. For this reason, it is always advised to ensure that your index fits entirely in the RAM. To get the current indexSize of your collection, run the command :

db.collection.totalIndexSize()

You will get a value like 36864 bytes. This value should also not be taking a large percentage of the overall RAM size, since you need to cater for the needs of the entire working set of the server.

An efficient query should also enhance Selectivity. Selectivity can be defined as the ability of a query to narrow the result using the index. To be more secant, your queries should limit the number of possible documents with the indexed field. Selectivity is mostly associated with a compound index which includes a low-selectivity field and another field. For example if you have this data:

{ _id: ObjectId(), a: 6, b: "no", c: 45 }
{ _id: ObjectId(), a: 7, b: "gh", c: 28 }
{ _id: ObjectId(), a: 7, b: "cd", c: 58 }
{ _id: ObjectId(), a: 8, b: "kt", c: 33 }

The query {a: 7, b: “cd”} will scan through 2 documents to return 1 matching document. However if the data for the value a is evenly distributed i.e

{ _id: ObjectId(), a: 6, b: "no", c: 45 }
{ _id: ObjectId(), a: 7, b: "gh", c: 28 }
{ _id: ObjectId(), a: 8, b: "cd", c: 58 }
{ _id: ObjectId(), a: 9, b: "kt", c: 33 }

The query {a: 7, b: “cd”} will scan through 1 document and return this document. Hence this will take shorter time than the first data structure.

ClusterControl
Single Console for Your Entire Database Infrastructure
Find out what else is new in ClusterControl

Resources Provisioning

Inadequate storage memory, RAM and other operating parameters can drastically degrade the performance of a MongoDB. For instance, if the number of user connections is very large, it will hinder the ability of the server application from handling requests in a timely manner. As discussed in Key things to monitor in MongoDB, you can get an overview of which limited resources you have and how you can scale them to suit your specifications. For a large number of concurrent application requests, the database system will be overwhelmed in keeping up with the demand.

Replication Lag

Sometimes you may notice some data missing from your database or when you delete something, it appears again. As much as you could have well designed schema, appropriate indexing and enough resources, in the beginning your application will run smoothly without any hiccups but then at some point you notice the latter mentioned problems. MongoDB relies on replication concept where data is redundantly copied to meet some design criteria. An assumption with this is that the process is instantaneous. However, some delay may occur maybe due to network failure or unhandled errors. In a nutshell, there will be a large gap between the time with which an operation is processed on the primary node and the time it will be applied in the secondary node.

Setbacks with Replica Lags

  1. Inconsistent data. This is especially associated with read operations that are distributed across secondaries.

  2. If the lag gap is wide enough, then a lot of unreplicated data may be on the primary node and will need to be reconciled in the secondary node. At some point, this may be impossible especially when the primary node cannot be recovered.

  3. Failure to recover the primary node can force one to run a node with data which is not up to date and consequently may drop the whole database in order to make the primary to recover.

Causes of the Secondary Node Failure

  1. Outmatching primary power over the secondary regarding the CPU, disk IOPS and network I/O specifications.

  2. Complex write operations. For example a command like

    db.collection.update( { a: 7}  , {$set: {m: 4} }, {multi: true} )

    The primary node will record this operation in the oplog quick enough. However, for the secondary node, it has to fetch those ops, read into RAM any index and data pages in order to meet some criteria specifications such as the id. Since it has to do this quick enough in order to keep the rate with the primary node does the operation, if the number of ops is large enough then there will be an expected lag.

  3. Locking of the secondary when making a backup. In this case we may forget to disable the primary hence will continue with its operations as normal. At the time when the lock will be released, replication lag will have be of a large gap especially when dealing with a huge amount of data backup.

  4. Index building. If an index builds up in the secondary node, then all other operations associated with it are blocked. If the index is long-running then the replication lag hiccup will be encountered.

  5. Unconnected secondary. Sometimes the secondary node may fail due to network disconnections and this results in a replication lag when it is reconnected.

How to Minimize the Replication Lag

  • Use unique indexes besides your collection having the _id field. This is to avoid the replication process from failing completely.

  • Consider other types of backup such as point-in-time and filesystem snapshots which not necessarily require locking.

  • Avoid building large indexes since they cause background blocking operation.

  • Make the secondary powerful enough. If the write operation is of lightweight, then using underpowered secondaries will be economical. But, for heavy write loads, the secondary node may lag behind the primary. To be more seccant, the secondary should have enough bandwidth to help reading oplogs fast enough in order to keep its rate with the primary node.

Efficient Query Techniques

Beside creating indexed queries and using Query Selectivity as discussed above, there are other concepts you can employ to fasten and make your queries effective.

Optimizing Your Queries

  1. Using a covered query. A covered query is one which is always completely satisfied by an index hence does not need to examine any document. The covered query therefore should have all fields as part of the index and consequently the result should contain all these fields.

    Let’s consider this example:

    {_id: 1, product: { price: 50 }

    If we create an index for this collection as

    {“product.price”: 1} 

    Considering a find operation, then this index will cover this query;

    db.collection.find( {“product.price”: 50}, {“product.price”: 1, _id: 0}  )

    and return the product.price field and value only.

  2. For embedded documents, use the dot notation (.). The dot notation helps in accessing elements of an array and fields of embedded document.

    Accessing an array:

    {
       prices: [12, 40, 100, 50, 40]  
    }

    To specify the fourth element for example, you can write this command:

    “prices.3”

    Accessing an object array:

    {
    
       vehicles: [{name: toyota, quantity: 50},
                 {name: bmw, quantity: 100},
                 {name: subaru, quantity: 300}                    
    } 

    To specify the name field in the vehicles array you can use this command

    “vehicles.name”
  3. Check if a query is is covered. To do this use the db.collection.explain(). This function will provide information on the execution of other operations -e.g. db.collection.explain().aggregate(). To learn more about the explain function you can check out explain().

In general, the supreme technique as far as querying is concerned is using indexes. Querying only an index is much faster than querying documents outside of the index. They can fit in memory hence available in RAM rather than in disk. This makes the easy and fast enough to fetch them from memory.

A Performance Cheat Sheet for MongoDB

$
0
0

Database performance affects organizational performance, and we tend to want to look for a quick fix. There are many different avenues to improve performance in MongoDB. In this blog, we will help you to understand better your database workload, and things that may cause harm to it. Knowledge of how to use limited resources is essential for anybody managing a production database.

We will show you how to identify the factors that limit database performance. To ensure that database performs as expected, we will start from the free MongoDB Cloud monitoring tool. Then we will check how to manage log files and how to examine queries. To be able to achieve optimal usage of hardware resources, we will take a look into kernel optimization and other crucial OS settings. Finally, we will look into MongoDB replication and how to examine performance.

Free Monitoring of performance

MongoDB introduced a free performance monitoring tool in the cloud for standalone instances and replica sets. When enabled, the monitored data is uploaded periodically to the vendor’s cloud service. That does not require any additional agents, the functionality is built into the new MongoDB 4.0+. The process is fairly simple to setup and manage. After the single command activation, you will get a unique Web address to access your recent performance stats. You can only access monitored data that has been uploaded within the past 24 hours.

Here is how to activate this feature. You can enable/disable free monitoring during runtime using:

-- Enable Free Monitoring
db.enableFreeMonitoring()
-- Disable Free Monitoring
db.disableFreeMonitoring()

You can also enable or disable free monitoring during mongod startup using either the configuration file setting cloud.monitoring.free.state or the command-line option --enableFreeMonitoring

db.enableFreeMonitoring()

After the activation, you will see a message with the actual status.

{
    "state" : "enabled",
    "message" : "To see your monitoring data, navigate to the unique URL below. Anyone you share the URL with will also be able to view this page. You can disable monitoring at any time by running db.disableFreeMonitoring().",
    "url" : "https://cloud.mongodb.com/freemonitoring/cluster/XEARVO6RB2OTXEAHKHLKJ5V6KV3FAM6B",
    "userReminder" : "",
    "ok" : 1
}

Simply copy/paste the URL from the status output to the browser, and you can start checking performance metrics.

MongoDB Free monitoring provides information about the following metrics:

  • Operation Execution Times (READ, WRITES, COMMANDS)
  • Disk utilization (MAX UTIL % OF ANY DRIVE, AVERAGE UTIL % OF ALL DRIVES)
  • Memory (RESIDENT, VIRTUAL, MAPPED)
  • Network - Input / Output (BYTES IN, BYTES OUT)
  • Network - Num Requests (NUM REQUESTS)
  • Opcounters (INSERT, QUERY, UPDATE, DELETE, GETMORE, COMMAND)
  • Opcounters - Replication (INSERT, QUERY, UPDATE, DELETE, GETMORE, COMMAND)
  • Query Targeting (SCANNED / RETURNED, SCANNED OBJECTS / RETURNED)
  • Queues (READERS, WRITERS, TOTAL)
  • System Cpu Usage (USER, NICE, KERNEL, IOWAIT, IRQ, SOFT IRQ, STEAL, GUEST)
MongoDB Free Monitoring first use
MongoDB Free Monitoring System CPU Usage
MongoDB Free Monitoring Charts

To view the state of your free monitoring service, use following method:

db.getFreeMonitoringStatus()

The serverStatus and the helper db.serverStatus() also includes free monitoring statistics in the free Monitoring field.

When running with access control, the user must have the following privileges to enable free monitoring and get status:

{ resource: { cluster : true }, actions: [ "setFreeMonitoring", "checkFreeMonitoringStatus" ] }

This tool may be a good start for those who find it difficult to read MongoDB server status output from the commandline:

db.serverStatus()

Free Monitoring is a good start but it has very limited options, if you need a more advanced tool you may want to check MongoDB Ops Manager or ClusterControl.

Logging database operations

MongoDB drivers and client applications can send information to the server log file. Such information depends on the type of the event. To check current settings, login as admin and execute:

db.getLogComponents()

Log messages include many components. This is to provide a functional categorization of the messages. For each of the component, you can set different log verbosity. The current list of components is:

ACCESS, COMMAND, CONTROL, FTD, GEO, INDEX, NETWORK, QUERY, REPL_HB, REPL, ROLLBACK, REPL, SHARDING, STORAGE, RECOVERY, JOURNAL, STORAGE, WRITE.

For more details about each of the components, check the documentation.

Capturing queries - Database Profiler

MongoDB Database Profiler collects information about operations that run against a mongod instance. By default, the profiler does not collect any data. You can choose to collect all operations (value 2), or those that take longer than the value of slowms. The latter is an instance parameter which can be controled through the mongodb configuration file. To check the current level:

db.getProfilingLevel()

To capture all queries set:

db.setProfilingLevel(2)

In the configuration file, you can set:

profile = <0/1/2>
slowms = <value>

This setting will be applied on a single instance and not propagate across a replica set or shared cluster, so you need to repeat this command of all of the nodes if you want to capture all activities. Database profiling can impact database performance. Enable this option only after careful consideration.

Then to list the 10 most recent:

db.system.profile.find().limit(10).sort(
{ ts : -1 }
).pretty()

To list all:

db.system.profile.find( { op:
{ $ne : 'command' }
} ).pretty()

And to list for a specific collection:

db.system.profile.find(
{ ns : 'mydb.test' }
).pretty()

MongoDB logging

MongoDB log location is defined in your configuration’s logpath setting, and it’s usually /var/log/mongodb/mongod.log. You can find MongoDB configuration file at /etc/mongod.conf.

Here is sample data:

2018-07-01T23:09:27.101+0000 I ASIO     [NetworkInterfaceASIO-Replication-0] Connecting to node1:27017
2018-07-01T23:09:27.102+0000 I ASIO     [NetworkInterfaceASIO-Replication-0] Failed to connect to node1:27017 - HostUnreachable: Connection refused
2018-07-01T23:09:27.102+0000 I ASIO     [NetworkInterfaceASIO-Replication-0] Dropping all pooled connections to node1:27017 due to failed operation on a connection
2018-07-01T23:09:27.102+0000 I REPL_HB  [replexec-2] Error in heartbeat (requestId: 21589) to node1:27017, response status: HostUnreachable: Connection refused
2018-07-01T23:09:27.102+0000 I ASIO     [NetworkInterfaceASIO-Replication-0] Connecting to node1:27017

You can modify log verbosity of the component by setting (query example):

db.setLogLevel(2, "query")

The log file can be significant, so you may want to clear it before profiling. From the MongoDB commandline console, enter:

db.runCommand({ logRotate : 1 });

Checking operating system parameters

Memory limits

To see the limits associated with your login, use the command ulimit -a. The following thresholds and settings are particularly important for mongod and mongos deployments:

-f (file size): unlimited
-t (cpu time): unlimited
-v (virtual memory): unlimited
-n (open files): 64000
-m (memory size): unlimited [1]
-u (processes/threads): 32000

The newer version of the mongod startup script (/etc/init.d/mongod) has the default settings built into the start option:

start()
{
  # Make sure the default pidfile directory exists
  if [ ! -d $PIDDIR ]; then
    install -d -m 0755 -o $MONGO_USER -g $MONGO_GROUP $PIDDIR
  fi

  # Make sure the pidfile does not exist
  if [ -f "$PIDFILEPATH" ]; then
      echo "Error starting mongod. $PIDFILEPATH exists."
      RETVAL=1
      return
  fi

  # Recommended ulimit values for mongod or mongos
  # See http://docs.mongodb.org/manual/reference/ulimit/#recommended-settings
  #
  ulimit -f unlimited
  ulimit -t unlimited
  ulimit -v unlimited
  ulimit -n 64000
  ulimit -m unlimited
  ulimit -u 64000
  ulimit -l unlimited

  echo -n $"Starting mongod: "
  daemon --user "$MONGO_USER" --check $mongod "$NUMACTL $mongod $OPTIONS >/dev/null 2>&1"
  RETVAL=$?
  echo
  [ $RETVAL -eq 0 ] && touch /var/lock/subsys/mongod
}

The role of the memory management subsystem also called the virtual memory manager is to manage the allocation of physical memory (RAM) for the entire kernel and user programs. This is controled by the vm.* parameters. There are two which you should consider in first place in order to tune MongoDB performance - vm.dirty_ratio and vm.dirty_background_ratio.

vm.dirty_ratio is the absolute maximum amount of system memory that can be filled with dirty pages before everything must get committed to disk. When the system gets to this point, all new I/O blocks until dirty pages have been written to disk. This is often the source of long I/O pauses. The default is 30, which is usually too high. vm.dirty_background_ratio is the percentage of system memory that can be filled with “dirty” pages — memory pages that still need to be written to disk. The good start is to go from 10 and measure performance. For a low memory environment, 20 is a good start. A recommended setting for dirty ratios on large-memory database servers is vm.dirty_ratio = 15 and vm.dirty_background_ratio = 5 or possibly less.

To check dirty ratio run:

sysctl -a | grep dirty

You can set this by adding the following lines to “/etc/sysctl.conf”:

Swappiness

On servers where MongoDB is the only service running, it’s a good practice to set vm.swapiness = 1. The default setting is set to 60 which is not appropriate for a database system.

vi /etc/sysctl.conf
vm.swappiness = 1

Transparent huge pages

If you are running your MongoDB on RedHat, make sure that Transparent Huge Pages is disabled.
This can be checked by commnad:

cat /proc/sys/vm/nr_hugepages 
0

0 means that transparent huge pages are disabled.

Filesystem options

ext4 rw,seclabel,noatime,data=ordered 0 0

NUMA (Non-Uniform Memory Access)

MongoDB does not support NUMA, disable it in BIOS.

Network stack

net.core.somaxconn = 4096
net.ipv4.tcp_fin_timeout = 30
net.ipv4.tcp_keepalive_intvl = 30
net.ipv4.tcp_keepalive_time = 120
net.ipv4.tcp_max_syn_backlog = 4096

NTP deamon

To install NTP time server demon, use one of the following system commands.

#Red Hat
sudo yum install ntp
#Debian
sudo apt-get install ntp

You can find more details about OS performance for MongoDB in another blog.

Explain plan

Similar to other popular database systems, MongoDB provides an explain facility which reveals how a database operation was executed. The explain results display the query plans as a tree of stages. Each stage passes its events (i.e. documents or index keys) to the parent node. The leaf nodes access the collection or the indices.You can add explain('executionStats') to a query.

db.inventory.find( {
     status: "A",
     $or: [ { qty: { $lt: 30 } }, { item: /^p/ } ]
} ).explain('executionStats');
or append it to the collection:
db.inventory.explain('executionStats').find( {
     status: "A",
     $or: [ { qty: { $lt: 30 } }, { item: /^p/ } ]
} );

The keys whose values you should watch out for in the output of the above command execution:

  • totalKeysExamined: The total number of index entries scanned to return query.
  • totalDocsExamined: The total number of documents scanned to find the results.
  • executionTimeMillis: Total time in milliseconds required for query plan selection and query execution.

Measuring replication lag performance

Replication lag is a delay between an operation on the primary and the application of that operation from the oplog to the secondary. In other words, it defines how far the secondary is behind the primary node, which in the best case scenario, should be as close as possible to 0.

Replication process can be affected for multiple reasons. One of the main issues could be the secondary members are running out of server capacity. Large write operations on the primary member leading to secondary members being unable to replay the oplogs, or Index building on the primary member.

To check the current replication lag, run in a MongoDB shell:

db.getReplicationInfo()
db.getReplicationInfo() 
{
    "logSizeMB" : 2157.1845703125,
    "usedMB" : 0.05,
    "timeDiff" : 4787,
    "timeDiffHours" : 1.33,
    "tFirst" : "Sun Jul 01 2018 21:40:32 GMT+0000 (UTC)",
    "tLast" : "Sun Jul 01 2018 23:00:19 GMT+0000 (UTC)",
    "now" : "Sun Jul 01 2018 23:00:26 GMT+0000 (UTC)"

Replication status output can be used to assess the current state of replication, and determine if there is any unintended replication delay.

rs.printSlaveReplicationInfo()

It shows the time delay between the secondary members with respect to the primary.

rs.status()

It shows the in-depth details for replication. We can gather enough information about replication by using these commands. Hopefully, these tips give a quick overview of how to review MongoDB performance. Let us know if we’ve missed anything.

Planning & Managing Schemas in MongoDB (Even Though It’s Schemaless)

$
0
0

When MongoDB was introduced, the main feature highlighted was it’s ability to be “schemaless”. What does it mean? It means that one can store JSON documents, each with different structure, in the same collection. This is pretty cool. But the problem starts when you need to retrieve the documents. How do you tell that a retrieved document is of a certain structure, or whether it contains a particular field or not? You have to loop through all the documents and search for that particular field. This is why it is useful to carefully plan the MongoDB schema, especially for the large applications.

When it comes to MongoDB, there is no specific way to design the schema. It all depends on your application and how your application is going to use the data. However, there are some common practices that you can follow while designing your database schema. Here, I will discuss these practices and their pros and cons.

One-to-Few Modeling (Embedding)

This design is a very good example of embedding documents. Consider this example of a Person collection to illustrate this modeling.

{
  name: "Amy Cooper",
  hometown: "Seoul",
  addresses: [
    { city: 'New York', state: 'NY', cc: 'USA' },
    { city: 'Jersey City', state: 'NJ', cc: 'USA' }
  ]
}

Pros:

  • You can get all the information in a single query.

Cons:

  • Embedded data is completely dependent on the parent document. You can’t search the embedded data independently.
  • Consider the example where you are creating a task-tracking system using this approach. Then you will embed all tasks specific to one person in the Person collection. If you want to fire a query like: Show me all tasks which have tomorrow as a deadline. This can be very difficult, even though it is a simple query. In this case, you should consider other approaches.

One-to-Many Modeling (Referencing)

In this type of modeling, the parent document will hold the reference Id (ObjectID) of the child documents. You need to use application level joins (combining two documents after retrieving them from DB at the application level) to retrieve documents, so no database level joins. Hence, the load on a database will be reduced. Consider this example:

// Parts collection
{
  _id: ObjectID(1234),
  partno: '1',
  name: ‘Intel 100 Ghz CPU',
  qty: 100,
  cost: 1000,
  price: 1050
}
// Products collection
{
  name: 'Computer WQ-1020',
  manufacturer: 'ABC Company',
  catalog_number: 1234,
  parts: [
    ObjectID(‘1234’), <- Ref. for Part No: 1
    ObjectID('2345'),
    ObjectID('3456')
  ]
}

Suppose each product may have several thousand parts associated with it. For this kind of database, referencing is the ideal type of modeling. You put the reference ids of all the associated parts under product document. Then you can use application level joins to get the parts for a particular product.

Pros:

  • In this type of modeling, each part is a separate document so you can apply all part related queries on these documents. No need to be dependent on parent document.
  • Very easy to perform CRUD (Create, Read, Update, Write) operations on each document independently.

Cons:

  • One major drawback with this method is that you have to perform one extra query to get the part details. So that you can perform application-level joins with the product document to get the necessary result set. So it may lead to drop in DB performance.
Severalnines
 
Become a MongoDB DBA - Bringing MongoDB to Production
Learn about what you need to know to deploy, monitor, manage and scale MongoDB

One-to-Millions Modeling (Parent Referencing)

When you need to store tons of data in each document, you can’t use any of the above approaches because MongoDB has a size limitation of 16MB per document. A perfect example of this kind of scenario can be an event logging system which collects logs from different type of machines and stores them in Logs and Machine collections.

Here, you can’t even think about using the Embedding approach which stores all logs information for a particular machine in a single document. This is because in only a few hours, the document size will be more than 16MB. Even if you only store reference ids of all the logs document, you will still exhaust the 16MB limit because some machines can generate millions of logs messages in a single day.

So in this case, we can use the parent referencing approach. In this approach, instead of storing reference ids of child documents in the parent document, we will store the reference id of the parent document in all child documents. So for our example, we will store ObjectID of the machine in Logs documents. Consider this example:

// Machines collection
{
  _id : ObjectID('AAA'),
  name : 'mydb.example.com',
  ipaddr : '127.66.0.4'
}
// Logs collection
{
  time : ISODate("2015-09-02T09:10:09.032Z"),
  message : 'WARNING: CPU usage is critical!',
  host: ObjectID('AAA')       -> references Machine document
}

Suppose you want to find most recent 3000 logs of Machine 127.66.0.4:

machine = db.machines.findOne({ipaddr : '127.66.0.4'});
msgs = db.logmsg.find({machine: machine._id}).sort({time : -1}).limit(3000).toArray()

Two Way Referencing

In this approach, we store the references on both sides which means, parent’s reference will be stored in child document and child’s reference will be stored in parent document. This makes searching relatively easy in one to many modeling. For example, we can search on both parent and task documents.On the other hand, this approach requires two separate queries to update one document.

// person
{
  _id: ObjectID("AAAA"),
  name: "Bear",
  tasks [ 
    ObjectID("AAAD"),
    ObjectID("ABCD"), -> Reference of child document
    ObjectID("AAAB")
  ]
}
// tasks
{
  _id: ObjectID("ABCD"),
  description: "Read a Novel",
  due_date:  ISODate("2015-11-01"),
  owner: ObjectID("AAAA") -> Reference of parent document
}

Conclusion

In the end, it all depends on your application requirements. You can design the MongoDB schema in a way which is the most beneficial for your application and gives you high performance. Here are some summarized considerations that you can consider while designing your schema.

  1. Design the schema based on your application’s data access patterns.
  2. It is not necessary to embed documents every time. Combine documents only if you are going to use them together.
  3. Consider duplication of data because storage is cheaper than compute power nowadays.
  4. Optimize schema for more frequent use cases.
  5. Arrays should not grow out of bound. If there are more than a couple of hundred child documents then don’t embed it.
  6. Prefer application-level joins to database-level joins. With proper indexing and proper use of projection fields, it can save you lots of time.

ClusterControl Release 1.6.2: New Backup Management and Security Features for MySQL & PostgreSQL

$
0
0

We are excited to announce the 1.6.2 release of ClusterControl - the all-inclusive database management system that lets you easily automate and manage highly available open source databases in any environment: on-premise or in the cloud.

ClusterControl 1.6.2 introduces new exciting Backup Management as well as Security & Compliance features for MySQL & PostgreSQL, support for MongoDB v 3.6 … and more!

Release Highlights

Backup Management

  • Continuous Archiving and Point-in-Time Recovery (PITR) for PostgreSQL
  • Rebuild a node from a backup with MySQL Galera clusters to avoid SST

Security & Compliance

  • New, consolidated Security section

Additional Highlights

  • Support for MongoDB v 3.6

View the ClusterControl ChangeLog for all the details!

ClusterControl
Single Console for Your Entire Database Infrastructure
Find out what else is new in ClusterControl

View Release Details and Resources

Release Details

Backup Management

One of the issues with MySQL and PostgreSQL is that there aren’t really any out-of-the-box tools for users to simply (in the GUI) pick up restore-time: certain operations need to be performed to do that, such as finding the full backup, restore it and apply any changes manually that happened after the backup was taken.

ClusterControl provides a single process to restore data to point in time with no extra actions needed.

With the same system, users can verify their backups (in the case of MySQL for instance, ClusterControl will do the installation, set up the cluster, do a restore and, if the backup is sound, make it valid - which, as one can imagine, represents a lot of steps).

With ClusterControl, users can not only go back to a point in time, but also pick up the exact transaction that happened; and, with surgical precision, restore their data before disaster really strikes.

New for PostgreSQL

Continuous Archiving and Point-in-Time Recovery (PITR) for PostgreSQL: ClusterControl automates that process now and enables continuous WAL archiving as well as a PITR with backups.

New for MySQL Galera Cluster

Rebuild a node from a backup with MySQL Galera clusters to avoid SST: ClusterControl reduces the time it takes to recover a node by avoiding streaming a full dataset over the network from another node.

Security & Compliance

The new Security section in ClusterControl lets users easily check which security features they have enabled (or disabled) for their clusters, thus simplifying the process of taking the relevant security measures for their setups.

Additional New Functionalities

View the ClusterControl ChangeLog for all the details!


Download ClusterControl today!

Happy Clustering!

An Introduction to MongoDB Zone Basics

$
0
0

MongoDB Zones

To understand MongoDB Zones, we must first understand what a Zone is: a group of shards based on a specific set of tags.

MongoDB Zones help in the distribution of chunks based on tags, across shards. All the work (reads and writes) related to documents within a zone are done on shards matching that zone.

There can be different scenarios where sharded clusters (zone-based) can prove to be highly useful. Let’s say:

  • An application, which is geographically distributed may require the frontend, as well as the data store
  • An application has an n-tier architecture such that some records are fetched from a higher tier (low latency) hardware, whereas other ones could be fetched from a low tier (high latency inducing) hardware

Benefits of Using MongoDB Zones

With the help of MongoDB Zones, DBAs can make tiered storage solutions that support the data lifecycle, with frequently-used data stored in memory, less used data stored on the server, and at the proper time archived data taken offline.

How to Setup Zones

In sharded clusters, you can create zones that represent a group of shards and associate one or more ranges of shard key values to that zone. MongoDB routes all reads and all writes that come into a zone range only to those shards inside of the zone. You can associate each zone with one or more shards in the cluster and a shard can associate with any number of zones.

Some of the most common deployment patterns where zones may be applied are as follows:

  • Isolate a specific subset of data on a specific set of shards.
  • By ensuring that the most relevant data reside on shards that are geographically closest to the application servers.
  • Route data to the shards on the basis of the performance of the shard hardware.

The following image illustrates a sharded cluster with three shards and two zones. The A zone represents a range with a lower bound of 0 and an upper bound of 10. The B zone shows a range with a lower bound of 10 and an upper bound of 20. Shards RED and BLUE have the A zone. Shard BLUE also has the B zone. Shard GREEN has no zones associated with it. The cluster is in a steady state and no chunks violate any of the zones

Range of a MongoDB Zone

Each and every zone covers one or more ranges of shard key values. Each range a zone covers is always inclusive of its lower boundary and exclusive of its upper boundary.

REMEMBER: Zones cannot share ranges and they cannot have overlapping ranges.

Adding Shards to a Zone

sh.addShardTag() method is used to add zones to a shard. A single shard may have multiple zones, and multiple shards may also have the same zone. The following example adds the zone A to one shard.

sh.addShardTag("shard0000", "A")

Removing Shards to a Zone

To remove a zone from a shard, the sh.removeShardTag() method is used. The following example removes the zone A from a shard.

sh.removeShardTag("shard0002", "A")
Severalnines
 
Become a MongoDB DBA - Bringing MongoDB to Production
Learn about what you need to know to deploy, monitor, manage and scale MongoDB

Tips for MongoDB Zones

Keep documents simple

MongoDB is a schema-free database. This means there is no predefined schema by default. We can add a predefined schema in newer versions, but it is not mandatory. Don’t underestimate the difficulties which occur when working with documents and arrays, as it can become really difficult to parse your data in the application side/ETL process. Besides, arrays can hurt replication performance: for every change in the array, all the array values are replicated.

Best hardware is not always the best option

Using good hardware definitely helps for a good performance. But what could happen in an environment when one instance of a big machine dies? The answer is ‘failover’.

Having multiple small machines (instead of one or two) in a distributed environment can ensure that outages are going to affect only a few parts of the shard with little or no perception by the application. But at the same time, more machines implies a high probability to have a failure. Consider this tradeoff when designing your environment. The right choices affect performance.

Working set

How big is the working set? Usually, an application doesn't use all the data. Some data is updated often, while other data isn't. Does your working dataset fit in RAM? Optimal performance occurs when all the working data set is in RAM.

A Review of MongoDB Backup Options

$
0
0

Database backup is nothing but a way to protect or restore data. It is the process of storing the operational state, architecture, and data of your database. It can be very useful in situations of technical outage or disaster. So it is essential to keep the backup of your database and that your database has a good and easy process for backup.

MongoDB provides several tools/techniques to backup your databases easily.

In this article, we will discuss some of the top MongoDB backup and restore workflows.

Generally, there are three most common options to backup your MongoDB server/cluster.

  • Mongodump/Mongorestore
  • MongoDB Cloud Manager
  • Database Snapshots

Apart from these general options, there are other ways to backup your MongoDB. We will discuss all these options as well in this article. Let’s get started.

MongoDump/MongoRestore

If you have a small database (<100GB) and you want to have full control of your backups, then Mongodump and Mongorestore are your best options. These are mongo shell commands which can be used to manually backup your database or collections. Mongodump dumps all the data in Binary JSON(BSON) format to the specified location. Mongorestore can use this BSON files to restore your database.

Backup a Whole Database

$ sudo mongodump --db mydb --out /var/backups/mongo

Output:

2018-08-20T10:11:57.685-0500    writing mydb.users to /var/backups/mongo/mydb/users.bson
2018-08-20T10:11:57.907-0500    writing mydb.users metadata to /var/backups/mongo/mydb/users.metadata.json
2018-08-20T10:11:57.911-0500    done dumping mydb.users (25000 documents)
2018-08-20T10:11:57.911-0500    writing mydb.system.indexes to /var/backups/mongo/mydb/system.indexes.bson

In this command, the most important argument is --db. It specifies the name of the database that you want to backup. If you don’t specify this argument then the Mongodump command will backup all your databases which can be very intensive process.

Backup a Single Collection

$ mongodump -d mydb -o /var/backups/mongo --collection users

This command will backup only users collection in mydb database. If you don’t give this option then, it will backup all the collection in the database by default.

Taking Regular Backups Using Mongodump/Mongorestore

As a standard practice, you should be making regular backups of your MongoDB database. Suppose you want to take a backup every day at 3:03 AM, then in a Linux system you can do this by adding a cron entry in crontab.

$ sudo crontab -e

Add this line in crontab:

3 3 * * * mongodump --out /var/backups/mongo

Restore a Whole Database

For restoring the database, we can use Mongorestore command with --db option. It will read the BSON files created by Mongodump and restore your database.

$ sudo mongorestore --db mydb /var/backups/mongo/mydb

Output

2018-07-20T12:44:30.876-0500    building a list of collections to restore from /var/backups/mongo/mydb/ dir
2018-07-20T12:44:30.908-0500    reading metadata file from /var/backups/mongo/mydb/users.metadata.json
2018-07-20T12:44:30.909-0500    restoring mydb.users from file /var/backups/mongo/mydb/users.bson
2018-07-20T12:45:01.591-0500    restoring indexes for collection mydb.users from metadata
2018-07-20T12:45:01.592-0500    finished restoring mydb.users (25000 documents)
2018-07-20T12:45:01.592-0500    done

Restore a whole collection

To restore just a single collection from db, you can use the following command:

$ mongorestore -d mydb -c users mydb/users.bson

If your collection is backed up in JSON format instead of BSON then you can use the following command:

$ mongoimport --db mydb --collection users --file users.json --jsonArray

Advantages

  • Very simple to use
  • You have full access to your backup
  • You can put your backups at any location like NFS shares, AWS S3 etc.

Disadvantages

  • Every time it will take a full backup of the database, not just the difference.
  • For large databases, it can take hours to backup and restore the database.
  • It’s not point-in-time by default, which means that if your data changes while backing it up then your backup may result in inconsistency. You can use --oplog option to resolve this problem. It will take a snapshot of the database at the end of mongodump process.

MongoDB Ops Manager

Ops Manager is a management application for MongoDB which runs in your data center. It continuously backs up your data and provides point-in-time restore processes for your database. Within this application, there is an agent which connects to your MongoDB instances. It will first perform an initial sync to backup the current state of the database. The agent will keep sending the compressed and encrypted oplog data to Ops Manager so that you can have a continuous backup. Using this data, Ops Manager will create database snapshots. It will create a snapshot of your database every 6 hours and oplog data will be stored for 24 hours. You can configure the snapshot schedule anytime using the Ops Manager.

Advantages

  • It’s point-in-time by default
  • Doesn’t impact the production performance except for initial sync
  • Support for consistent snapshots of sharded clusters
  • Flexibility to exclude non-critical collections

Disadvantages

  • Network latency increases with the snapshot size while restoring the database.

MongoDB Cloud Manager

MongoDB Cloud Manager is cloud-based backup solution which provides point-in-time restore, continuous and online backup solution as a fully managed service. You can simply install the Cloud Manager agent to manage backup and restore of your database. It will store your backup data in MongoDB cloud.

Advantages

  • Very simple to use. Good GUI.
  • Continuous backup of queries and oplog.

Disadvantages

  • No control on backup data. It is stored in MongoDB cloud.
  • Cost depends on the size of the data and the amount of oplog changes.
  • Restore process is slow.

Snapshot Database Files

This is the simplest solution to backup your database. You can copy all the underlying files (content of data/ directory) and place it to any secure location. Before copying all the files, you should stop all the ongoing write operations to a database to ensure the data consistency. You can use db.fsyncLock() command to stop all the write operations.

There are two types of snapshots: one is cloud level snapshots and another is OS level snapshots.

If you are storing database data with a cloud service provider like AWS then you have to take AWS EBS snapshots for backup. In contrast, if you are storing DB files in native OS like Linux then you have to take LVM snapshots. LVM snapshots are not portable to other machines. So cloud bases snapshots are better than OS based snapshots.

Advantages

  • Easy to use.
  • Full control over snapshots. You can move it to any data center.
  • These snapshots are diff snapshots which store only the differences from previous snapshots.
  • No need to download the snapshots for restoring your database. You can just create a new volume from your snapshot.

Disadvantages

  • Using this method, you can only restore your database at breakup points.
  • Maintenance becomes very complex sometimes.
  • To coordinate backups across all the replica sets (in sharded system), you need a special devops team.
ClusterControl
Single Console for Your Entire Database Infrastructure
Find out what else is new in ClusterControl

MongoDB Consistent Backup tool

MongoDB consistent backup is a tool for performing consistent backups of MongoDB clusters. It can backup a cluster with one or many shards to a single point of the database. It uses Mongodump as a default backup method. Run the following command to take backup using this tool.

$ mongodb-consistent-backup -H localhost -P 27017 -u USERNAME -p PASSWORD -l /var/backups/mongo

All the backups generated by this commands are MongoRestore compatible. You can user mongorestore command with --oplogReplay option to ensure consistency.

$ mongorestore --host localhost --port 27017 -u USERNAME -p PASSWORD --oplogReplay --dir /var/backups/mongo/mydb/dump

Advantages

  • Fully open source
  • Works with sharded cluster
  • Provides an option for remote backup such as Amazon S3
  • Auto-scaling available
  • Very easy to install and run

Disadvantage

  • Not fully mature product
  • Very few remote upload options
  • Doesn’t support data encryption before saving to disk
  • Official code repository lacks proper testing

ClusterControl Backup

ClusterControl is an all in one automated database management system. It lets you monitor, deploy, manage & scale your database clusters with ease. It supports MySQL, MongoDB, PostgreSQL, Percona XtraDB and Galera Cluster. This software automates almost all the database operations like deploying a cluster, adding or removing a node from any cluster, continuous backups, scaling the cluster etc. All these things, you can do from one single GUI provided by the ClusterControl system.

ClusterControl provides a very nice GUI for MongoDB backup management with support for scheduling and creative reports. It gives you two options for backup methods.

  1. Mongodump
  2. Mongodb consistent backup

So users can choose any option according to their needs. This tool assigns a unique ID to all the backups and stores it under this path: ClusterControl > Settings > Backup > BackupID. If the specified node is not live while taking the backup then the tool will automatically find the live node from the cluster and carry on the backup process on that node. This tool also provides an option for scheduling the backups using any of the above backup methods. You can enable/disable any scheduling job by just toggling a button. ClusterControl runs the backup process in background so it won’t affect the other jobs in the queue.

Advantages

  • Easy installation and very simple to use
  • Multiple options for backup methods
  • Backup scheduling is very easy using a simple GUI form
  • Automated backup verification
  • Backup reports with status

Disadvantage

  • Both backup methods internally use mongodump, which has some issues with handling very large databases.

Conclusion

A good backup strategy is a critical part of any database management system. MongoDB offers many options for backups and recovery/restore. Along with a good backup method, it is very important to have multiple replicas of the database. This helps to restore the database without having the downtime of even one second. Sometimes for larger databases, the backup process can be very resource intensive. So your server should be equipped with good CPU, RAM, and more disk space to handle this kind of load. The backup process can increase the load on the server because of these reasons so you should run the backup process during the nights or non-peak hours.

How to Monitor your Database Servers using ClusterControl CLI

$
0
0

How would you like to merge "top" process for all your 5 database nodes and sort by CPU usage with just a one-liner command? Yeah, you read it right! How about interactive graphs display in the terminal interface? We introduced the CLI client for ClusterControl called s9s about a year ago, and it’s been a great complement to the web interface. It’s also open source..

In this blog post, we’ll show you how you can monitor your databases using your terminal and s9s CLI.

Introduction to s9s, The ClusterControl CLI

ClusterControl CLI (or s9s or s9s CLI), is an open source project and optional package introduced with ClusterControl version 1.4.1. It is a command line tool to interact, control and manage your database infrastructure using ClusterControl. The s9s command line project is open source and can be found on GitHub.

Starting from version 1.4.1, the installer script will automatically install the package (s9s-tools) on the ClusterControl node.

Some prerequisites. In order for you to run s9s-tools CLI, the following must be true:

  • A running ClusterControl Controller (cmon).
  • s9s client, install as a separate package.
  • Port 9501 must be reachable by the s9s client.

Installing the s9s CLI is straightforward if you install it on the ClusterControl Controller host itself:$ rm

$ rm -Rf ~/.s9s
$ wget http://repo.severalnines.com/s9s-tools/install-s9s-tools.sh
$ ./install-s9s-tools.sh

You can install s9s-tools outside of the ClusterControl server (your workstation laptop or bastion host), as long as the ClusterControl Controller RPC (TLS) interface is exposed to the public network (default to 127.0.0.1:9501). You can find more details on how to configure this in the documentation page.

To verify if you can connect to ClusterControl RPC interface correctly, you should get the OK response when running the following command:

$ s9s cluster --ping
PING OK 2.000 ms

As a side note, also look at the limitations when using this tool.

Example Deployment

Our example deployment consists of 8 nodes across 3 clusters:

  • PostgreSQL Streaming Replication - 1 master, 2 slaves
  • MySQL Replication - 1 master, 1 slave
  • MongoDB Replica Set - 1 primary, 2 secondary nodes

All database clusters were deployed by ClusterControl by using "Deploy Database Cluster" deployment wizard and from the UI point-of-view, this is what we would see in the cluster dashboard:

Cluster Monitoring

We will start by listing out the clusters:

$ s9s cluster --list --long
ID STATE   TYPE              OWNER  GROUP  NAME                   COMMENT
23 STARTED postgresql_single system admins PostgreSQL 10          All nodes are operational.
24 STARTED replication       system admins Oracle 5.7 Replication All nodes are operational.
25 STARTED mongodb           system admins MongoDB 3.6            All nodes are operational.

We see the same clusters as the UI. We can get more details on the particular cluster by using the --stat flag. Multiple clusters and nodes can also be monitored this way, the command line options can even use wildcards in the node and cluster names:

$ s9s cluster --stat *Replication
Oracle 5.7 Replication                                                                                                                                                                                               Name: Oracle 5.7 Replication              Owner: system/admins
      ID: 24                                  State: STARTED
    Type: REPLICATION                        Vendor: oracle 5.7
  Status: All nodes are operational.
  Alarms:  0 crit   1 warn
    Jobs:  0 abort  0 defnd  0 dequd  0 faild  7 finsd  0 runng
  Config: '/etc/cmon.d/cmon_24.cnf'
 LogFile: '/var/log/cmon_24.log'

                                                                                HOSTNAME    CPU   MEMORY   SWAP    DISK       NICs
                                                                                10.0.0.104 1  6% 992M 120M 0B 0B 19G 13G   10K/s 54K/s
                                                                                10.0.0.168 1  6% 992M 116M 0B 0B 19G 13G   11K/s 66K/s
                                                                                10.0.0.156 2 39% 3.6G 2.4G 0B 0B 19G 3.3G 338K/s 79K/s

The output above gives a summary of our MySQL replication together with the cluster status, state, vendor, configuration file and so on. Down the line, you can see the list of nodes that fall under this cluster ID with a summarized view of system resources for each host like number of CPUs, total memory, memory usage, swap disk and network interfaces. All information shown are retrieved from the CMON database, not directly from the actual nodes.

You can also get a summarized view of all databases on all clusters:

$ s9s  cluster --list-databases --long
SIZE        #TBL #ROWS     OWNER  GROUP  CLUSTER                DATABASE
  7,340,032    0         0 system admins PostgreSQL 10          postgres
  7,340,032    0         0 system admins PostgreSQL 10          template1
  7,340,032    0         0 system admins PostgreSQL 10          template0
765,460,480   24 2,399,611 system admins PostgreSQL 10          sbtest
          0  101         - system admins Oracle 5.7 Replication sys
Total: 5 databases, 789,577,728, 125 tables.

The last line summarizes that we have total of 5 databases with 125 tables, 4 of them are on our PostgreSQL cluster.

For a complete example of usage on s9s cluster command line options, check out s9s cluster documentation.

Node Monitoring

For nodes monitoring, s9s CLI has similar features with the cluster option. To get a summarized view of all nodes, you can simply do:

$ s9s node --list --long
STAT VERSION    CID CLUSTER                HOST       PORT  COMMENT
coC- 1.6.2.2662  23 PostgreSQL 10          10.0.0.156  9500 Up and running
poM- 10.4        23 PostgreSQL 10          10.0.0.44   5432 Up and running
poS- 10.4        23 PostgreSQL 10          10.0.0.58   5432 Up and running
poS- 10.4        23 PostgreSQL 10          10.0.0.60   5432 Up and running
soS- 5.7.23-log  24 Oracle 5.7 Replication 10.0.0.104  3306 Up and running.
coC- 1.6.2.2662  24 Oracle 5.7 Replication 10.0.0.156  9500 Up and running
soM- 5.7.23-log  24 Oracle 5.7 Replication 10.0.0.168  3306 Up and running.
mo-- 3.2.20      25 MongoDB 3.6            10.0.0.125 27017 Up and Running
mo-- 3.2.20      25 MongoDB 3.6            10.0.0.131 27017 Up and Running
coC- 1.6.2.2662  25 MongoDB 3.6            10.0.0.156  9500 Up and running
mo-- 3.2.20      25 MongoDB 3.6            10.0.0.35  27017 Up and Running
Total: 11

The most left-hand column specifies the type of the node. For this deployment, "c" represents ClusterControl Controller, 'p" for PostgreSQL, "m" for MongoDB, "e" for Memcached and s for generic MySQL nodes. The next one is the host status - "o" for online, "l" for off-line, "f" for failed nodes and so on. The next one is the role of the node in the cluster. It can be M for master, S for slave, C for controller and - for everything else. The remaining columns are pretty self-explanatory.

You can get all the list by looking at the man page of this component:

$ man s9s-node

From there, we can jump into a more detailed stats for all nodes with --stats flag:

$ s9s node --stat --cluster-id=24
 10.0.0.104:3306
    Name: 10.0.0.104              Cluster: Oracle 5.7 Replication (24)
      IP: 10.0.0.104                 Port: 3306
   Alias: -                         Owner: system/admins
   Class: CmonMySqlHost              Type: mysql
  Status: CmonHostOnline             Role: slave
      OS: centos 7.0.1406 core     Access: read-only
   VM ID: -
 Version: 5.7.23-log
 Message: Up and running.
LastSeen: Just now                    SSH: 0 fail(s)
 Connect: y Maintenance: n Managed: n Recovery: n Skip DNS: y SuperReadOnly: n
     Pid: 16592  Uptime: 01:44:38
  Config: '/etc/my.cnf'
 LogFile: '/var/log/mysql/mysqld.log'
 PidFile: '/var/lib/mysql/mysql.pid'
 DataDir: '/var/lib/mysql/'
 10.0.0.168:3306
    Name: 10.0.0.168              Cluster: Oracle 5.7 Replication (24)
      IP: 10.0.0.168                 Port: 3306
   Alias: -                         Owner: system/admins
   Class: CmonMySqlHost              Type: mysql
  Status: CmonHostOnline             Role: master
      OS: centos 7.0.1406 core     Access: read-write
   VM ID: -
 Version: 5.7.23-log
 Message: Up and running.
  Slaves: 10.0.0.104:3306
LastSeen: Just now                    SSH: 0 fail(s)
 Connect: n Maintenance: n Managed: n Recovery: n Skip DNS: y SuperReadOnly: n
     Pid: 975  Uptime: 01:52:53
  Config: '/etc/my.cnf'
 LogFile: '/var/log/mysql/mysqld.log'
 PidFile: '/var/lib/mysql/mysql.pid'
 DataDir: '/var/lib/mysql/'
 10.0.0.156:9500
    Name: 10.0.0.156              Cluster: Oracle 5.7 Replication (24)
      IP: 10.0.0.156                 Port: 9500
   Alias: -                         Owner: system/admins
   Class: CmonHost                   Type: controller
  Status: CmonHostOnline             Role: controller
      OS: centos 7.0.1406 core     Access: read-write
   VM ID: -
 Version: 1.6.2.2662
 Message: Up and running
LastSeen: 28 seconds ago              SSH: 0 fail(s)
 Connect: n Maintenance: n Managed: n Recovery: n Skip DNS: n SuperReadOnly: n
     Pid: 12746  Uptime: 01:10:05
  Config: ''
 LogFile: '/var/log/cmon_24.log'
 PidFile: ''
 DataDir: ''

Printing graphs with the s9s client can also be very informative. This presents the data the controller collected in various graphs. There are almost 30 graphs supported by this tool as listed here and s9s-node enumerates them all. The following shows server load histogram of all nodes for cluster ID 1 as collected by CMON, right from your terminal:

It is possible to set the start and end date and time. One can view short periods (like the last hour) or longer periods (like a week or a month). The following is an example of viewing the disk utilization for the last hour:

Using the --density option, a different view can be printed for every graph. This density graph shows not the time series, but how frequently the given values were seen (X-axis represents the density value):

If the terminal does not support Unicode characters, the --only-ascii option can switch them off:

The graphs have colors, where dangerously high values for example are shown in red. The list of nodes can be filtered with --nodes option, where you can specify the node names or use wildcards if convenient.

Process Monitoring

Another cool thing about s9s CLI is it provides a processlist of the entire cluster - a “top” for all nodes, all processes merged into one. The following command runs the "top" command on all database nodes for cluster ID 24, sorted by the most CPU consumption, and updated continuously:

$ s9s process --top --cluster-id=24
Oracle 5.7 Replication - 04:39:17                                                                                                                                                      All nodes are operational.
3 hosts, 4 cores, 10.6 us,  4.2 sy, 84.6 id,  0.1 wa,  0.3 st,
GiB Mem : 5.5 total, 1.7 free, 2.6 used, 0.1 buffers, 1.1 cached
GiB Swap: 0 total, 0 used, 0 free,

PID   USER     HOST       PR  VIRT      RES    S   %CPU   %MEM COMMAND
12746 root     10.0.0.156 20  1359348    58976 S  25.25   1.56 cmon
 1587 apache   10.0.0.156 20   462572    21632 S   1.38   0.57 httpd
  390 root     10.0.0.156 20     4356      584 S   1.32   0.02 rngd
  975 mysql    10.0.0.168 20  1144260    71936 S   1.11   7.08 mysqld
16592 mysql    10.0.0.104 20  1144808    75976 S   1.11   7.48 mysqld
22983 root     10.0.0.104 20   127368     5308 S   0.92   0.52 sshd
22548 root     10.0.0.168 20   127368     5304 S   0.83   0.52 sshd
 1632 mysql    10.0.0.156 20  3578232  1803336 S   0.50  47.65 mysqld
  470 proxysql 10.0.0.156 20   167956    35300 S   0.44   0.93 proxysql
  338 root     10.0.0.104 20     4304      600 S   0.37   0.06 rngd
  351 root     10.0.0.168 20     4304      600 R   0.28   0.06 rngd
   24 root     10.0.0.156 20        0        0 S   0.19   0.00 rcu_sched
  785 root     10.0.0.156 20   454112    11092 S   0.13   0.29 httpd
   26 root     10.0.0.156 20        0        0 S   0.13   0.00 rcuos/1
   25 root     10.0.0.156 20        0        0 S   0.13   0.00 rcuos/0
22498 root     10.0.0.168 20   127368     5200 S   0.09   0.51 sshd
14538 root     10.0.0.104 20        0        0 S   0.09   0.00 kworker/0:1
22933 root     10.0.0.104 20   127368     5200 S   0.09   0.51 sshd
28295 root     10.0.0.156 20   127452     5016 S   0.06   0.13 sshd
 2238 root     10.0.0.156 20   197520    10444 S   0.06   0.28 vc-agent-007
  419 root     10.0.0.156 20    34764     1660 S   0.06   0.04 systemd-logind
    1 root     10.0.0.156 20    47628     3560 S   0.06   0.09 systemd
27992 proxysql 10.0.0.156 20    11688      872 S   0.00   0.02 proxysql_galera
28036 proxysql 10.0.0.156 20    11688      876 S   0.00   0.02 proxysql_galera

There is also a --list flag which returns a similar result without continuous update (similar to "ps" command):

$ s9s process --list --cluster-id=25

Job Monitoring

Jobs are tasks performed by the controller in the background, so that the client application does not need to wait until the entire job is finished. ClusterControl executes management tasks by assigning an ID for every task and lets the internal scheduler decide whether two or more jobs can be run in parallel. For example, more than one cluster deployment can be executed simultaneously, as well as other long running operations like backup and automatic upload of backups to cloud storage.

In any management operation, it's would be helpful if we could monitor the progress and status of a specific job, like e.g., scale out a new slave for our MySQL replication. The following command add a new slave, 10.0.0.77 to scale out our MySQL replication:

$ s9s cluster --add-node --nodes="10.0.0.77" --cluster-id=24
Job with ID 66992 registered.

We can then monitor the jobID 66992 using the job option:

$ s9s job --log --job-id=66992
addNode: Verifying job parameters.
10.0.0.77:3306: Adding host to cluster.
10.0.0.77:3306: Testing SSH to host.
10.0.0.77:3306: Installing node.
10.0.0.77:3306: Setup new node (installSoftware = true).
10.0.0.77:3306: Setting SELinux in permissive mode.
10.0.0.77:3306: Disabling firewall.
10.0.0.77:3306: Setting vm.swappiness = 1
10.0.0.77:3306: Installing software.
10.0.0.77:3306: Setting up repositories.
10.0.0.77:3306: Installing helper packages.
10.0.0.77: Upgrading nss.
10.0.0.77: Upgrading ca-certificates.
10.0.0.77: Installing socat.
...
10.0.0.77: Installing pigz.
10.0.0.77: Installing bzip2.
10.0.0.77: Installing iproute2.
10.0.0.77: Installing tar.
10.0.0.77: Installing openssl.
10.0.0.77: Upgrading openssl openssl-libs.
10.0.0.77: Finished with helper packages.
10.0.0.77:3306: Verifying helper packages (checking if socat is installed successfully).
10.0.0.77:3306: Uninstalling existing MySQL packages.
10.0.0.77:3306: Installing replication software, vendor oracle, version 5.7.
10.0.0.77:3306: Installing software.
...

Or we can use the --wait flag and get a spinner with progress bar:

$ s9s job --wait --job-id=66992
Add Node to Cluster
- Job 66992 RUNNING    [         █] ---% Add New Node to Cluster

That's it for today's monitoring supplement. We hope that you’ll give the CLI a try and get value out of it. Happy clustering!


MongoDB Aggregation Framework Stages and Pipelining - New Whitepaper

$
0
0

We’re happy to announce that our new whitepaper MongoDB Aggregation Framework Stages and Pipelinings is now available to download for free!

In this whitepaper, we deep-dive into MongoDB’s Aggregation Framework and look into the different stages of the Aggregation Pipeline. We also look at how we make use of these stages in an aggregation process and then look at the operators that can assist in the analysis process of input documents. Finally, we also compare the aggregation process in MongoDB with SQL, as well as the differences between the aggregation process and MapReduce in MongoDB.

Topics included in this whitepaper are…

  • What is the Aggregation Framework?
  • Aggregation Pipeline
    • Basic Stages of Aggregation Pipeline
  • Aggregation Process
  • Accumulator Operators
  • Similarity of the Aggregation Process in MongoDB with SQL
  • Aggregation Pipeline Optimization
    • Projection Optimization
    • Pipeline Sequence Optimization
  • MapReduce in MongoDB
    • MapReduce JavaScript Functions
    • Incremental MapReduce
  • Comparison Between MapReduce and Aggregation Pipeline in MongoDB
  • Summary

Download the whitepaper today!

ClusterControl
Single Console for Your Entire Database Infrastructure
Find out what else is new in ClusterControl

About the Author

Onyancha Brian Henry, Guest Writer

Onyancha Brian Henry is a guest writer for Severalnines.  Based in Kenya, he is a web developer and graphic designer with great interest in upcoming trends in web development.  Brian uses MongoDB regularly with his freelance clients. His passion is to impress the client as a key to his success.

About Severalnines

Severalnines provides automation and management software for database clusters. We help companies deploy their databases in any environment, and manage all operational aspects to achieve high-scale availability.

Severalnines' products are used by developers and administrators of all skills levels to provide the full 'deploy, manage, monitor, scale' database cycle, thus freeing them from the complexity and learning curves that are typically associated with highly available database clusters. Severalnines is often called the “anti-startup” as it is entirely self-funded by its founders. The company has enabled over 32,000 deployments to date via its popular product ClusterControl. Currently counting BT, Orange, Cisco, CNRS, Technicolor, AVG, Ping Identity and Paytrail as customers. Severalnines is a private company headquartered in Stockholm, Sweden with offices in Singapore, Japan and the United States. To see who is using Severalnines today visit, https://www.severalnines.com/company.

How ClusterControl Monitors your Database Servers and Clusters Agentlessly

$
0
0

ClusterControl’s agentless approach allows sysadmins and DBAs to monitoring their databases without having to install agent software on each monitored system. Monitoring is implemented using a remote data collector that uses the SSH protocol.

But first, let’s clarify the scope and meaning of monitoring within our context here. Monitoring comes after data trending - the metrics collection and storing process - which allows the monitoring system to process the collected data to produce justification for tuning, alerting, as well as displaying trending data for reporting.

Generally, ClusterControl performs its monitoring, alerting and trending duties by using the following three ways:

  • SSH - Host metrics collection (process, load balancers stats, resource usage and consumption etc) using SSH library.
  • Database client - Database metrics collection (status, queries, variables, usage etc) using the respective database client library.
  • Advisor - Mini programs written using ClusterControl DSL and running within ClusterControl itself, for monitoring, tuning and alerting purposes.

Some description of the above - SSH stands for Secure Shell, a secure network protocol which is used by most of the Linux-based servers for remote administration. ClusterControl Controller, or CMON, is the backend service performing automation, management, monitoring and scheduling tasks, built on top of C++.

ClusterControl DSL (Domain Specific Language) allows you to extend the functionality of your ClusterControl platform by creating Advisors, Auto Tuners, or "Mini Programs". The DSL syntax is based on JavaScript, with extensions to provide access to ClusterControl internal data structures and functions. The DSL allows you to execute SQL statements, run shell commands/programs across all your cluster hosts, and retrieve results to be processed for advisors/alerts or any other actions.

Monitoring Tools

All of the prerequisite tools will be met by the installer script or will be automatically installed by ClusterControl during the database deployment stage, or if the required file/binary/package does not exist on the target server before executing a job. Generally speaking, ClusterControl monitoring duty only requires OpenSSH server package on the monitored hosts. ClusterControl uses libssh client library to collect host metrics for the monitored hosts - CPU, memory, disk, network, IO, process, etc. OpenSSH client package is required on the ClusterControl host only for setting up passwordless SSH and debugging purposes. Other SSH implementations like Dropbear and TinySSH are not supported.

When gathering the database stats and metrics, ClusterControl Controller (CMON) connects to the database server directly via database client libraries - libmysqlclient (MySQL/MariaDB and ProxySQL), libpq (PostgreSQL) and libmongocxx (MongoDB). That is why it's crucial to setup proper privileges for ClusterControl server from database servers perspective. For MySQL-based clusters, ClusterControl requires database user "cmon" while for other databases, any username can be used for monitoring, as long as it is granted with super-user privileges. Most of the time, ClusterControl will setup the required privileges (or use the specified database user) automatically during the cluster import or cluster deployment stage.

For load balancers, ClusterControl requires the following tools:

  • Maxadmin on the MariaDB MaxScale server.
  • netcat and/or socat on the HAProxy server to connect to HAProxy socket file and retrieve the monitoring data.
  • ProxySQL requires mysql client on the ProxySQL server.

The following diagram illustrates both host and database monitoring processes executed by ClusterControl using libssh and database client libraries:

Although monitoring threads do not need database client packages to be installed on the monitored host, it's highly recommended to have them for management purposes. For example, MySQL client package comes with mysql, mysqldump, mysqlbinlog and mysqladmin programs which will be used by ClusterControl when performing backups and point-in-time recovery.

Monitoring Methods

For host and load balancer stats collection, ClusterControl executes this task via SSH with super-user privilege. Therefore, passwordless SSH with super-user privilege is vital, to allow ClusterControl to run the necessary commands remotely with proper escalation. With this pull approach, there are a couple of advantages as compared to other mechanisms:

  • Agentless - There is no need for agent to be installed, configured and maintained.
  • Unifying the management and monitoring configuration - SSH can be used to pull monitoring metrics or push management jobs on the target nodes.
  • Simplify the deployment - The only requirement is proper passwordless SSH setup and that's it. SSH is also very secure and encrypted.
  • Centralized setup - One ClusterControl server can manage multiple servers and clusters, provided it has sufficient resources.

However, there are also drawbacks with the pull mechanism:

  • The monitoring data is accurate only from ClusterControl perspective. For example, if there is a network glitch and ClusterControl loses communication to the monitored host, the sampling will be skipped until the next available cycle.
  • For high granularity monitoring, there will be network overhead due to increase sampling rate where ClusterControl needs to establish more connections to every target hosts.
  • ClusterControl will keep on attempting to re-establish connection to the target node, because it has no agent to do this on its behalf.
  • Redundant data sampling if you have more than one ClusterControl server monitoring a cluster, since each ClusterControl server has to pull the monitoring data for itself.

For MySQL query monitoring, ClusterControl monitors the queries in two different ways:

  1. Queries are retrieved from PERFORMANCE_SCHEMA, by querying the schema on the database node via SSH.
  2. If PERFORMANCE_SCHEMA is disabled or unavailable, ClusterControl will parse the content of the Slow Query Log via SSH.

If Performance Schema is enabled, ClusterControl will use it to look for the slow queries. Otherwise, ClusterControl will parse the content of the MySQL slow query log (via slow_query_log=ON dynamic variable) based on the following flow:

  1. Start slow log (during MySQL runtime).
  2. Run it for a short period of time (a second or couple of seconds).
  3. Stop log.
  4. Parse log.
  5. Truncate log (new log file).
  6. Go to 1.

The collected queries are hashed, calculated and digested (normalize, average, count, sort) and then stored in ClusterControl CMON database. Take note that for this sampling method, there is a slight chance some queries will not be captured, especially during “stop log, parse log, truncate log” parts. You can enable Performance Schema if this is not an option.

If you are using the Slow Query log, only queries that exceed the Long Query Time will be listed here. If the data is not populated correctly and you believe that there should be something in there, it could be:

  • ClusterControl did not collect enough queries to summarize and populate data. Try to lower the Long Query Time.
  • You have configured Slow Query Log configuration options in the my.cnf of MySQL server, and Override Local Query is turned off. If you really want to use the value you defined inside my.cnf, probably you have to lower the long_query_time value so ClusterControl can calculate a more accurate result.
  • You have another ClusterControl node pulling the Slow Query log as well (in case you have a standby ClusterControl server). Only allow one ClusterControl server to do this job.

For more details (including how to enable the PERFORMANCE_SCHEMA), see this blog post, How to use the ClusterControl Query Monitor for MySQL, MariaDB and Percona Server.

For PostgreSQL query monitoring, ClusterControl requires pg_stat_statements module, to track execution statistics of all SQL statements. It populates the pg_stat_statements views and functions when displaying the queries in the UI (under Query Monitor tab).

Intervals and Timeouts

ClusterControl Controller (cmon) is a multi-threaded process. By default, ClusterControl Controller sampling thread connects to each monitored host once and maintain persistent connection until the host drops or disconnects it when sampling host stats. It may establish more connections depending on the jobs assigned to the host, since most of the management jobs run in their own thread. For example, cluster recovery runs on the recovery thread, Advisor execution runs on a cron-thread, as well as process monitoring which runs on process collector thread.

ClusterControl monitoring thread performs the following sampling operations in the following interval:

  • MySQL query/status metrics: every second
  • Process collection (/proc): every 10 seconds
  • Server detection: every 10 seconds
  • Host metrics (/proc, /sys): every 30 seconds (configurable via host_stats_collection_interval)
  • Database metrics (PostgreSQL and MongoDB only): every 30 seconds (configurable via db_stats_collection_interval)
  • Database schema metrics: every 3 hours (configurable via db_schema_stats_collection_interval)
  • Load balancer metrics: every 15 seconds (configurable via lb_stats_collection_interval)

The imperative scripts (Advisors) can make use of SSH and database client libraries that come with CMON with the following restrictions:

  • 5 seconds of hard limit for SSH execution,
  • 10 seconds of default limit for database connection, configurable via net_read_timeout, net_write_timeout, connect_timeout in CMON configuration file,
  • 60 seconds of total script execution time limit before CMON ungracefully aborts it.

Advisors can be created, compiled, tested and scheduled directly from ClusterControl UI, under Manage -> Developer Studio. The following screenshot shows an example of an Advisor to extract top 10 queries from PERFORMANCE_SCHEMA:

The execution of advisors is depending if it is activated and the scheduling time in cron format:

The results of the execution are displayed under Performance -> Advisors, as shown in the following screenshot:

For more information on what Advisors being provided by default, check out our Developer Studio product page.

For short-interval monitoring data like MySQL queries and status, data are stored directly into CMON database. While for long-interval monitoring data like weekly/monthly/yearly data points are aggregated every 60 seconds and stored in memory for 10 minutes. These behaviours are not configurable due to the architecture design.

ClusterControl
Single Console for Your Entire Database Infrastructure
Find out what else is new in ClusterControl

Parameters

There are plethora of parameters you can configure for ClusterControl to suit your monitoring and alerting policy. Most of them are configurable through ClusterControl UI -> pick a cluster -> Settings. The "Settings" tab provide many options to configure alerts, thresholds, notifications, graphs layout, database counters, query monitoring and so on. For example, warning and critical thresholds can be configured as follows:

There are also "Runtime Configuration" page, a summarized list of the active ClusterControl Controller (CMON) runtime configuration parameters:

There are more than 170 ClusterControl Controller configuration options in total and some of the advanced settings can be configured to finely tune your monitoring and alerting policy. To list out some of them:

  • monitor_cpu_temperature
  • swap_warning
  • swap_critical
  • redobuffer_warning
  • redobuffer_critical
  • indexmemory_warning
  • indexmemory_critical
  • datamemory_warning
  • datamemory_critical
  • tablespace_warning
  • tablespace_critical
  • redolog_warning
  • redolog_critical
  • max_replication_lag
  • long_query_time
  • log_queries_not_using_indexes
  • query_monitor_use_local_settings
  • enable_query_monitor
  • enable_query_monitor_auto_purge_ps

The parameters listed in the "Runtime Configuration" page can be changed either by using the UI or CMON configuration file located at /etc/cmon.d/cmon_X.cnf, where X is the cluster ID. You can list out all of the supported configuration options for CMON by using the following command:

$ cmon --help-config

The same output is also available in the documentation page, ClusterControl Controller Configuration Options.

Final Thoughts

We hope this blog has given you a good understanding of how ClusterControl monitors your database servers and clusters agentlessly. We’ll be shortly announcing some significant new features in the next version of ClusterControl so stay tuned!

New Webinar - Free Monitoring (on Steroids) for MySQL, MariaDB, PostgreSQL and MongoDB

$
0
0

Monitoring is essential for operations teams to ensure that databases are up and running. However, as databases are increasingly being deployed in distributed topologies based on replication or clustering, what does it mean to our monitoring infrastructure? Is it ok to monitor individual components of a database cluster, or do we need a more holistic systems approach? Can we rely on SELECT 1 as health check when determining whether a database is up or down? Do we need high-resolution time-series charts of status counters? Are there ways to predict problems before they actually become one?

In this webinar, we will discuss how to effectively monitor distributed database clusters or replication setups. We’ll look at different types of monitoring infrastructures, from on-prem to cloud and from agent-based to agentless. Then we’ll dive into the different monitoring features available in the free ClusterControl Community Edition - from time-series charts of metrics, dashboards, and queries to performance advisors.

If you would like to centralize the monitoring of your open source databases and achieve this at zero cost, please join us on September 25!

Date, Time & Registration

Europe/MEA/APAC

Tuesday, September 25th at 09:00 BST / 10:00 CEST (Germany, France, Sweden)

Register Now

North America/LatAm

Tuesday, September 25th at 09:00 Pacific Time (US) / 12:00 Eastern Time (US)

Register Now

Agenda

  • Requirements for monitoring distributed database systems
  • Cloud-based vs On-prem monitoring solutions
  • Agent-based vs Agentless monitoring
  • Deep-dive into ClusterControl Community Edition
    • Architecture
    • Metrics Collection
    • Trending
    • Dashboards
    • Queries
    • Performance Advisors
    • Other features available to Community users

Speaker

Bartlomiej Oles is a MySQL and Oracle DBA, with over 15 years experience in managing highly available production systems at IBM, Nordea Bank, Acxiom, Lufthansa, and other Fortune 500 companies. In the past five years, his focus has been on building and applying automation tools to manage multi-datacenter database environments.

We look forward to “seeing” you there!

A Developer’s Guide to MongoDB Replica Sets

$
0
0

MongoDB often involves working with a large set of data including embedded arrays and array objects. Therefore, it is always important to ensure your database processing rate is as fast as possible to enhance read and write operations. Besides, to avoid data anomalies that may arise due to data inconsistency, you need to ensure your data is in increased availability just in case you would like to have a recovery from an event of hardware failure or some service interruptions. MongoDB provides some 2 concepts for that purpose - ReplicaSets and Sharding.

Replication in MongoDB

Master-Slave Replication

This is one of the oldest techniques used to ensure data is always available to users even when one system failed. However, Master-Slave replication is deprecated in the latest versions of MongoDB as from 3.2 and was thus replaced with Replica sets.

To make this configuration, one starts 2 mongod instances while considering one is in master mode and the other is slave mode.

To start an instance in master mode, run:

mongod --master --port portNumber

The --master options instructs mongod to create a local.oplog.$main collection with which a list of operations are queued for the slaves to apply in replicating the data.

To start a mongod instance in slave mode, just run:

mongod --slave --source <masterhostname><:<port>>

Here you need to specify the hostname and the port of the master instance to the --source argument. This is a summarized overview of using the Master slave replication and since it is deprecated, our interest will be on the Replica sets.

Replica Sets

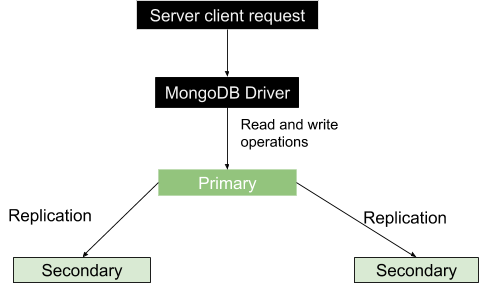
This is a group of MongoDB processes known as mongod instances that basically host the same data set. It is featured by one primary node and several secondary nodes for bearing data. The primary node receives all the write operations and records all other changes to its data set in its operation log. The secondary nodes, in the other end, replicate the primary’s operation log and apply the operations to their data set such that their data sets reflect the primary’s data set. In simple words, we can say we have machine A as the primary node and machine B and C as the secondary nodes. Machine A receives a write operation and makes changes to its data and then makes a list of the changes that have been made. Machines B and C will then copy operations from the list provided, in this case the oplog, and execute them so that the resulting data is same as in Machine A.

As mentioned before, it is always important to ensure high availability of data, especially in the production setting. Replication comes in to help by providing data redundancy in different Mongod instances. In case of data loss, since copies of same data are stored across different databases in multiple locations, it is easy to recover it in the existing one.

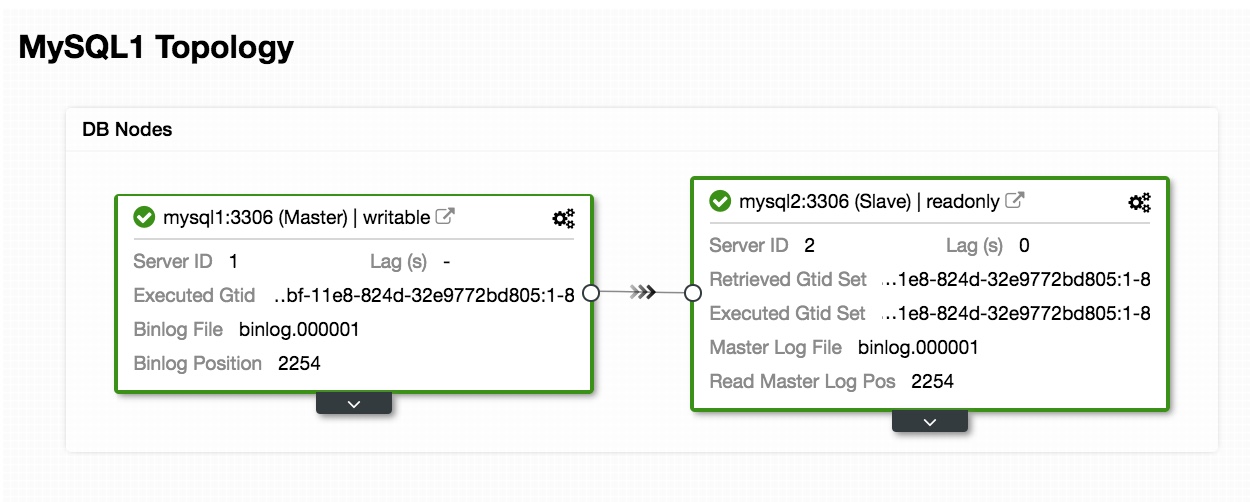
With many running instances, read and write operations from clients are sent to different servers and therefore the processing rate increases. The basic structure of the replication process is shown below.

Sometimes the primary may not be available for example due to internet disconnection or service interruption. In this case, the replica set will nominate a secondary to be the primary node. As much as the read requests are basically made to the primary, some occasions the read requests can be sent to the secondaries but be careful since the returned data may not reflect what is in the primary or rather the data may not be up to date.

Arbiters

In the case of election of a primary, you will need an extra mongod instance to the replica set to add a vote in the election process. This instance is referred to as an arbiter and its salient features are:

  1. It does not have a copy of the dataset, hence does not require as powerful hardware as the data bearing nodes..
  2. Cannot be promoted to become the primary.
  3. They always have 1 electoral vote so as to allow replica set to have an uneven number of voting members without the overhead of an additional member that replicates data. Its crucial role is, therefore, to select a primary node when it is not available.
  4. It remains unchanged.

Contrary to the arbiter, other replica sets can be converted into primary from secondary and vise-versa.

Asynchronous Replication

The process of replication takes place in two forms of data synchronization. First, the members in the set are populated with full data in the initial sync. The subsequent replication takes place to apply advancing changes to the entire data set.

In the initial sync, data is copied from one member of the replica set into another. When the process is completed, the member transitions into the secondary node.

MongoDB Automatic Failover

There can be a service interruption like network disconnection which comes with a consequence of terminating the communication between the primary and the secondaries. If the disconnection is more than 10 seconds or fails completely, the remaining replica set will vote for a member to become the new primary. The secondary node that gets the majority of the votes becomes the new primary.

In version 3.0 of MongoDB, a replica set can have up to 50 members with 7 voting members.

Priority Zero Replica Set Members

These are secondary members that can neither transit to be primary nodes nor can they trigger an election. There crucial roles in the data set are to: maintain data set copies, elect a primary node and perform read operations. They act like a backup where a new member may fail to add immediately. It will thus store the updated data and can immediately replace an unavailable member.

MongoDB Hidden Replica Set Members

These are members with no connection to the client applications. They are used for workloads with different usage requirements from other secondary members. They only receive the basic replication traffic that is during the initial sync.

MongoDB Delayed Replica Set Members

These copy data from the primary node’s oplog file within some specified duration. They always reflect the delayed state or a previous form of the set. They are therefore important in detecting errors and give a hint on how one can recover from those errors, for example if there is a database that has been dropped. When choosing the amount of delay, this should be in consideration:

  1. The duration should be less than the capacity of the operation log, which for the WiredTiger, MMAPv1 and In-Memory storage engines is 50GB. Otherwise, the delayed member cannot successfully replicate operations.
  2. The delay duration should be equal or slightly greater than your expected maintenance window durations.

Configuration

This is a priority zero member, it is hidden hence not visible to applications and lastly can participate in the election process. Therefore to configure a priority, let’s say you have 10 members in your replica set, you can select a member at position n as member[n] and set its properties as:

{
    “_id”: <num>, 
    “Host”: <hostname: port>,
    “Priority”: 0,
    “slaveDelay”: <seconds>,
    “Hidden”: true
} 

Or using the mongo shell connected to the primary you can run this commands to set the first member of the replica set as a delayed:

cfg = rs.conf()
cfg.members[0].priority = 0
cfg.members[0].hidden = true
cfg.members[0].slaveDelay = 3600
rs.reconfig(cfg)

After setting this configurations, the delayed secondary cannot become a primary and therefore hidden from applications. The Member will be delayed by 1 hour (3600 seconds) from the oplog operations.

Severalnines
 
Become a MongoDB DBA - Bringing MongoDB to Production
Learn about what you need to know to deploy, monitor, manage and scale MongoDB

How Start a Replica Set

In this guide, we shall see step by step how we can configure a replica set in MongoDB.

  1. Let’s say you have 3 mongodb you want to replicate and they are configured as follows:
    1. Mongod1.conf running at port 27017
    2. Mongod2.conf running at port 27018
    3. Mongod3.conf running at port 27019

    Ensure to add the replica set name which will not change in each file. You can do so by adding or changing the option replSet value to a name of your choice.

  2. We can start the first instance by running

    sudo mongod --config /etc/mongo/mongod1.conf

    This is if, you have no mongod running instance. Then do the same for the other instances. To check for running instances in your machine run

    ps -ax | grep mongo

    You will get some list like this:

    4328 ttys000    0:06.15 mongod
    4950 ttys001    0:00.00 grep mongo
    This means that the first instance in MongoDB by default runs at port 27017 hence we have it as the first one in the list. If you started the others, they will also be outlined in the list with their corresponding path urls. To connect to an instance in the mongo shell, run this command:
    mongo  --port port_number i.e mongo  --port 27017.
    However in our case we need to connect with a replica set name so we have to add ithe name to the command:
    mongod --replSet replicaSetName --dbpath /usr/local/var/mongo/mongod --port 27017
    In this case our replicaSetName = “testrep”
  3. Let’s check if there is any replica set enabled by running rs.status()

    If you get a result like:

    {
        "ok" : 0,
        "errmsg" : "not running with --replSet",
        "code" : 76,
        "codeName" : "NoReplicationEnabled"
    }

    Then it means there is no replica set enabled. Else if you get the result as

    {
        "operationTime" : Timestamp(0, 0),
        "ok" : 0,
        "errmsg" : "no replset config has been received",
        "code" : 94,
        "codeName" : "NotYetInitialized",
        "$clusterTime" : {
            "clusterTime" : Timestamp(0, 0),
            "signature" : {
                "hash" : BinData(0,"AAAAAAAAAAAAAAAAAAAAAAAAAAA="),
                "keyId" : NumberLong(0)
            }
        }
    }

    then it mean the replica is not yet initiated.

  4. The rs.initiate()method will help us start a new replica set and the instance within which it is initiated becomes our primary node. So we can initiate one in our instance by running the initiate method. rs.initiate().

  5. Check the replica set status again by running rs.status().members. You should now see something like

    "members" : [
            {
                "_id" : 0,
                "name" : "localhost:27018",
                "health" : 1,
                "state" : 1,
                "stateStr" : "PRIMARY",
                "uptime" : 577,
                "optime" : {
                    "ts" : Timestamp(1535301271, 1),
                    "t" : NumberLong(1)
                },
                "optimeDate" : ISODate("2018-08-26T16:34:31Z"),
                "syncingTo" : "",
                "syncSourceHost" : "",
                "syncSourceId" : -1,
                "infoMessage" : "could not find member to sync from",
                "electionTime" : Timestamp(1535301265, 1),
                "electionDate" : ISODate("2018-08-26T16:34:25Z"),
                "configVersion" : 1,
                "self" : true,
                "lastHeartbeatMessage" : ""
            }
        ]

    Well, good to go. Our interest will be the members option, as we can see it is n array with 1 member in it. Checking the first member’s stateStr option in this case it is set to Primary which means that this will act as our primary node.

  6. Add a new member to the replica set using its hostname. To check for the hostname of the connected instance you want to add run

    db.serverStatus().host

    You will get something like

    ervername.local:27019

    So from the PRIMARY yo can add another member by running this command in the mongo shell:

    rs.add("servername.local:27019");
  7. Run the status command

    rs.status().members

    To check whether the changes have been made.

    You should now have something looking like this:

    [
        {
            "_id" : 0,
            "name" : "localhost:27018",
            "health" : 1,
            "state" : 1,
            "stateStr" : "PRIMARY",
            "uptime" : 11479,
            "optime" : {
                "ts" : Timestamp(1535312183, 1),
                "t" : NumberLong(1)
            },
            "optimeDate" : ISODate("2018-08-26T19:36:23Z"),
            "syncingTo" : "",
            "syncSourceHost" : "",
            "syncSourceId" : -1,
            "infoMessage" : "",
            "electionTime" : Timestamp(1535301265, 1),
            "electionDate" : ISODate("2018-08-26T16:34:25Z"),
            "configVersion" : 2,
            "self" : true,
            "lastHeartbeatMessage" : ""
        },
        {
            "_id" : 1,
            "name" : "127.0.0.1:27019",
            "health" : 1,
            "state" : 2,
            "stateStr" : "SECONDARY",
            "uptime" : 15,
            "optime" : {
                "ts" : Timestamp(1535312183, 1),
                "t" : NumberLong(1)
            },
            "optimeDurable" : {
                "ts" : Timestamp(1535312183, 1),
                "t" : NumberLong(1)
            },
            "optimeDate" : ISODate("2018-08-26T19:36:23Z"),
            "optimeDurableDate" : ISODate("2018-08-26T19:36:23Z"),
            "lastHeartbeat" : ISODate("2018-08-26T19:36:26.302Z"),
            "lastHeartbeatRecv" : ISODate("2018-08-26T19:36:27.936Z"),
            "pingMs" : NumberLong(0),
            "lastHeartbeatMessage" : "",
            "syncingTo" : "localhost:27018",
            "syncSourceHost" : "localhost:27018",
            "syncSourceId" : 0,
            "infoMessage" : "",
            "configVersion" : 2
        }
    ]

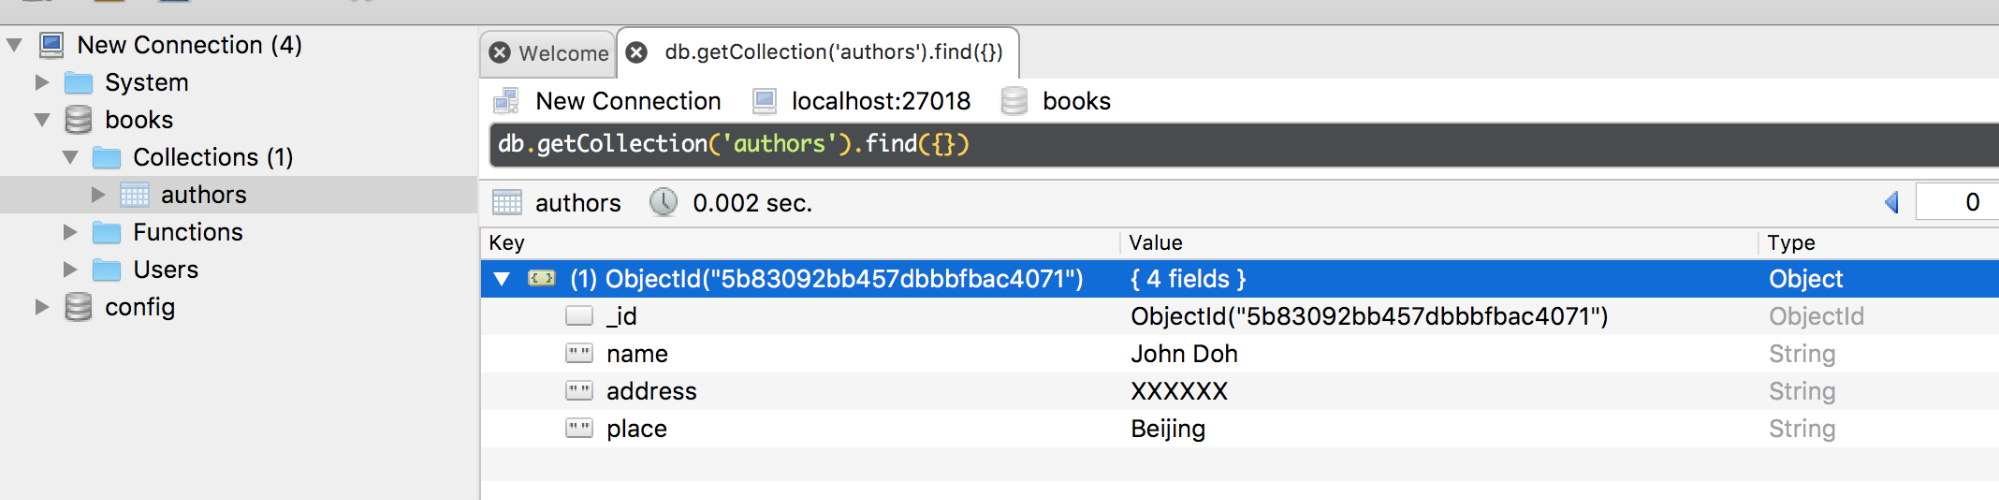
    We now have 2 members, one is a PRIMARY node and the other is a SECONDARY node. You can add more members but not exceeding 50. Now let us make a database in the instance at port 27018 as the primary.

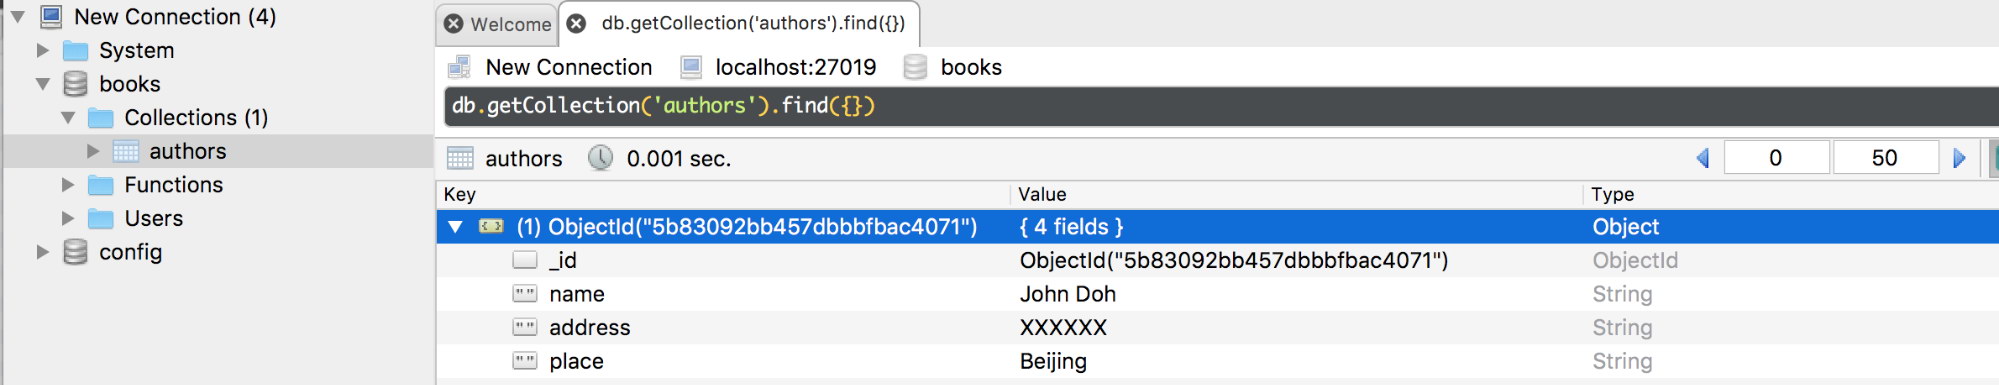
    If we disconnect the primary, a failover will happen and since we have only 1 primary it will automatically be transitioned into a secondary. Now if we connect to the one on port 27019 you should get the same databases and collections with their documents.

    Now if the disconnected primary node is reconnected, it will be added as a secondary as it copies operations from the oplog of the existing primary.

MongoDB Replica Set Write Concern

If MongoDB returns a successful journaled write concern, the data will be stored to the disk hence becoming available after mongod restarts. However, for the write operations, the data is durable only after it gets replicated and committed to the journal in favour from the majority of the voting member of the replica set.

Some data may be too large to update or insert, hence may take longer than expected for the data to be replicated in other members. For this reason it is advisable to edit the writeConcern configurations to cater for the duration within which an operation is to be executed. The default writeConcern configurations dictate that the replica set require acknowledgement only from the primary member. A default write concern confirms write operations for the primary only but can be overridden to check write operations on some replica set members by specifying the write concern for a specific write operation. For example:

db.books.insert({name: “James”,place: “Beijing”},{writeConcern: {w: 3, wtimeout: 3600}})

The write option in this case dictates that the operation should return a response only after the it has been spread to the primary and at least 2 secondaries or if it times out after 3.6 seconds.

Configuring the Write Concern for MongoDB

The MongoDB getLastErrorDefaults option gives us the parameters for altering the write concern default settings in the replica set configuration. This implies that the operation has to be complete in most of the voting members before returning the result.

cfg = rs.conf()
cfg.settings = {},
cfg.settings.getLastErrorDefaults = {w: “majority”, wtimeout: 3600}
rs.reconfig(cfg)

The timeout value will prevent blocking write operations that is to say, if there are supposed to be 5 members to acknowledge the write concern but unfortunately there are 4 or less members in the replica set, the operation will block until all the members are available. By adding the timeout threshold, the operation blocking will be discarded after this duration.

Replication Blocking

Blocking an operation especially when all the members have been replicated ensures no more time will be wasted waiting for another replica set member to be available in order to return a response. MongoDB getLastError command option dictates how the replication update is done using the optional “w” attribute.

For example, this query

db.runCommand({getLastError: 1, w: N, “wtimeout”: 5000});

requires that the blocking will occur until N number of members have replicated the last write operation. If N is available or is less than 2, the query will be returned. Else if the value for N is equal to 2, the master equivalent to the primary, will respond only after 1 of its slaves has been replicated to the last operation.

The wtimeout parameter is basically to set the time in milliseconds after which getLastError command will timeout and return an error before the last option has been replicated.

As much as blocking is somehow advantageous, sometimes it has a limitation. It significantly slows down the read operations especially if you set the “w” value to be too large. I would recommend you set the “w” value to either 2 or 3 for improved safety and efficiency.

Read Preference in MongoDB

This is basically the adjacent route with which the client read operations are made to the replica set. The default MongoDB setup configures the read operations to the primary because it is the one with the latest version of the document you are fetching. As mentioned before, the supreme advantage for exploiting the replica set is to improve performance of our database system. Thus, it is advisable to distribute the read operations to many secondary members to reduce latency for applications which do not necessarily require up to date data. However, there are more crucial reasons why you should also use the primary as you basic preference:

  1. Maintaining data availability during the failover.
  2. For geographically distributed applications, the primary will provide local reads for clients in the same datacenter.
  3. Not to affect the front-end applications, especially those running system operations.

Mongo.setReadPref() Method

This method is basically to define how the client will route all queries to members of the replica set. It takes 2 arguments, mode and tagSet.

The mode argument specifies the read preference which can either be primary, primaryPreferred, secondary, secondaryPreferred or nearest.

The tagSet mode specifies the custom read preference.You can also specify them as an array of objects. An example of the setup will be:

db.getMongo().setReadPref('primaryPreferred',
                          [ { "dc": "east", "use": "production" },
                            { "dc": "east", "use": "reporting" },
                            { "dc": "east" },
                            {}
                          ] )

What happens here is that, if the client tries to access the first tag and the request does not go through, they will be opted to the second read preference.

Read Preference Modes

  • Primary: this defines that all read operations read from a given replica set are primary and is the default preference read mode.
  • PrimaryPreferred: If only the primary is not available, then the read operations can be made from the secondaries.
  • Secondary: all read operations are made from the secondary members of the replica set.
  • SecondaryPreferred: if only there is no secondary available, the read operations can be made from the primary.
  • Nearest: member with least network latency is selected for the read operation irrespective of its type.

Tag Sets and their Configuration

These are options that enable you to model the way you want your write concern and read preference to look like. They are stored within the replica set configuration object. If you run rs.conf().members, you will get this object returned:

[
    {
        "_id" : 0,
        "host" : "localhost:27018",
        "arbiterOnly" : false,
        "buildIndexes" : true,
        "hidden" : false,
        "priority" : 1,
        "tags" : {
            
        },
        "slaveDelay" : NumberLong(0),
        "votes" : 1
    },
    {
        "_id" : 1,
        "host" : "127.0.0.1:27019",
        "arbiterOnly" : false,
        "buildIndexes" : true,
        "hidden" : false,
        "priority" : 1,
        "tags" : {
            
        },
        "slaveDelay" : NumberLong(0),
        "votes" : 1
    }
]

As you can see, each member has tags attribute.

The main difference between Read Preferences and Write Concern is that, the former considers the value of a tag when selecting a member to read from while the latter does not.

Let’s say a tag set for a read operation is set to:

{ "disk": "ssd", "use": "reporting" }

A member in the replica set has to fulfill these tags for the read operation to go through. Therefore to say, a configuration like this

{ "disk": "ssd", "use": "reporting", "rack": "a" }

will satisfy the query whereas this one

{ "disk": "ssd", "use": "production", "rack": "k" }

will not satisfy the query.

Adding Tags to a Set Replica

For your selected member in a replica set, you can addtag sets using the rs.conf() method in MongoDB.

Let’s say you have selected a member in position 1 of your replica set array, you can add tag sets as follows.

conf = rs.conf()
conf.members[0].tags = { "dc": "NYK", "use": "production"  }
conf.members[1].tags = { "dc": "LON", "use": "reporting"  }
conf.members[2].tags = { "use": "production"  }
rs.reconfig(conf)

Deployment Patterns for MongoDB Replica Set

  1. Geographically distributed replica set - Enhances redundancy of data besides protecting data against faults such as power loss. The running instances are located in multiple locations.
  2. Three member Replica Set - the basic standard architecture for a replica set.
  3. Four or more member Replica Set - Enables a wider redundancy of data and also supports a wider distribution of read operations in the Replica Set.

MongoDB Replica Set Deployment Tuning Techniques

An ideal replica set will require a well laid out architecture with at least 3 members for a production system. These deployment strategies will help you enable a great replica set.

  1. Use delayed and hidden members to support dedicated functions such as reporting and backup.
  2. Always make the number of deployed members odd. As we have discussed above, an odd number of members will be required in electing a primary. Therefore ensure you have an odd number and if not, you can always add an arbiter.
  3. For read-heavy deployments, you will need to balance the load. You will therefore be required to distribute reads to the secondary in order to improve read performance. Besides, when the data grows with time, you can add more members and distribute them but put in mind that you have to configure it in such a way that the paramount design is to elect the primary.
  4. Always consider fault tolerance. This is basically determining how many members can be unavailable at a given time and how many will remain to sustain the election process of a primary. If you don’t have a primary, unfortunately the replica set will not accept any write operation.
  5. Add new members to the existing replica set before demand arises.
  6. Use replica set tag sets to ensure that all operations are replicated at specific data centers. You can also use these tags in routing for the read operations for specific deployment machines.
  7. Deploy most of your members in one location to shun the setback that will arise from network partitioning. Network partitioning can be the result of disconnected communication between data centers, consequently hindering the replication process and the process of electing a primary.
  8. For safety reasons, distribute your members geographically besides making some hidden. You can set at least 2 or 3 members’ priority to zero so as to prevent from making them primary.
  9. Employ journaling to protect data loss that may result to something like a power failure. This ensures that data is written to disk in case of sudden shutdown.

The Operation Log (Oplog)

The oplog maintains a record of the master operations that are to be applied to the slaves. It is stored in a database called local in oplog.$main collection. It is created when you start a replica set member for the first time. On the upper bound, the oplog is restricted to a size of 50GB for all storage engines. The oplog size can be changed from a default setting. If this size is reached for example in 24 hours of operation, the secondaries will not be able to copy from it during this duration comfortably and may end up not copying at all. You can change the size of the oplog using the option replSetResizeOplog i.e.

db.database({replSetResizeOplog:1, size: 16384})

If you are to reduce the size of this oplog, it will result in some data being removed. The core impact of this in the replica set is that members synced to this node become stale. Thus, you will need to resync these members.

Workload Patterns that Would Require a Large Oplog Size

  1. Update to multiple documents at once. The multiple update operations must be translated to an individual operation for improving results across the nodes. This operation will use a vast space of the oplog space.
  2. Significant number of in-place updates. This generally happens when updating data of documents not necessarily increasing the size of this document. The database will record a large number of operation to the oplog hence increasing its size.
  3. Deletions equal the same amount of data as inserts. This happens when you try to delete an amount of data (almost) equal to the amount of data you insert. This operation will tend to increase the size of the oplog.

Conclusion

Replication is one important aspect of databases that developers need to understand. It ensures increased availability of data. Your MongoDB server may go down, for example, due to a power outage but you would still like your clients to access its data. If you have replicated data in another server, your clients will be able to continue accessing data from it if the primary server fails. Besides, there is increased load balancing so that instead of all users accessing one single server, we have seen the tradeoffs of serving traffic from secondary replicas.

How to Deploy MongoDB for High Availability

$
0
0

Introduction

MongoDB has great support for high availability through ReplicaSets. However, deploying a ReplicaSet is not enough for a production-ready system. The latter requires a bit of planning. Deployment is just the initial step, we then need to arm the operational teams with monitoring, alerting, security, anomaly or failure detection, automatic recovery/failover, backup management, and other tools to keep the environment up and running.

Prerequisites

Before you can start with your MongoDB deployment with ClusterControl, some preparations are required. The supported platforms are RedHat/CentOS 6.x/7.x, Ubuntu 12.04/14.04/16.04 LTS, and Debian 7.x/8.x The minimal OS resource requirements are 2GB of RAM, 2CPU and 20GB disk space running on x86 architecture. ClusterControl itself can run on regular VMs or barebone hosts running on-prem, behind a firewall, or on Cloud VMs.

Additionally, ClusterControl requires ports used by the following services to be opened/enabled:
ICMP (echo reply/request)
SSH (default is 22)
HTTP (default is 80)
HTTPS (default is 443)
MySQL (default is 3306) (internal database)
CMON RPC (default is 9500)
CMON RPC TLS (default is 9501)
CMON Events (default is 9510)
CMON SSH (default is 9511)
CMON Cloud (default is 9518)

Streaming port for backups through netcat (default is 9999)

The easiest and most convenient way to install ClusterControl is to use the installation script provided by Severalnines. Simply download the script and execute as the root user or user with sudo root permission. If you need a more manual approach, for instance if your servers are entirely without internet access, you can follow instructions provided in ClusterControl documentation.

$ wget http://www.severalnines.com/downloads/cmon/install-cc 
$ chmod +x install-cc
$ ./install-cc   # as root or sudo user

Follow the installation wizard where you will be guided with setting up an internal ClusterControl database server and it’s credentials,, the cmon password for ClusterControl usage and so on. You should get the following line once the installation has completed:

Determining network interfaces. This may take a couple of minutes. Do NOT press any key.
Public/external IP => http://{public_IP}/clustercontrol
Installation successful. 

Next step is to generate an SSH key which we will use to set up the passwordless SSH later on. If you have a key pair which you would like to use, you can skip creation of a new one.

You can use any user in the system but it must have the ability to perform super-user operations (sudoer). In this example, we picked the root user:

$ whoami
root
$ ssh-keygen -t rsa #generates ssh key

Set up passwordless SSH to all nodes that you would like to monitor/manage via ClusterControl. In this case, we will set this up on all nodes in the stack (including ClusterControl node itself). On ClusterControl node, run the following commands to copy ssh keys and specify the root password when prompted:

ssh-copy-id root@clustercontrolhost # clustercontrol
ssh-copy-id root@mongodbnode1
ssh-copy-id root@mongodbnode2
ssh-copy-id root@mongodbnode3
...

You can then verify if it's working by running the following command on ClusterControl node:

$ ssh root@192.168.55.151 "ls /root"

Make sure you are able to see the result of the command above without the need to enter a password.
When the installation is completed you should be able to login to the web interface via

https://<your_vm_name>/clustercontrol/#

After the first login, you will see a window with options to start with your first deployment or import an existing cluster.

ClusterControl Deploy and import existing cluster

Configure repositories

Before we start deploying, let’s take a look at the package management system. The ClusterControl deployment process supports the entire process of cluster installation. That includes OS adjustments and package download and installation. If your database nodes have limited access to the internet and you can not download packages directly from the node, you can create a package repository directly on the ClusterControl host.

ClusterControl package repository

There are three ways to maintain MongoDB packages in ClusterControl.

Use Vendor Repositories

Install the software by setting up and using the database vendor’s favored software repository. ClusterControl will install the latest version of what is stored by the MongoDB repository.

Do Not Setup Vendor Repositories

Install the software by using the pre-existing software repository already set up on the OS. The user has to set up the software repository manually on each database node, and ClusterControl will use this repository for package deployment. This is good if the database nodes are running without internet connections and your company has an external package system with MongoDB packages in place.

Use Mirrored Repositories (Create new repository)

Create and mirror the current vendor’s repository and then deploy using the local mirrored repository. It also allows you to “freeze” the recent versions of the software packages used to provision a database cluster for a specific vendor (i.e., use only Percona packages).

ClusterControl automates the creation of internal package repository

Deploy ReplicaSet

ClusterControl supports MongoDB/Percona Server for MongoDB 3.x ReplicaSet. To start with the deployment of the new cluster, go to the deploy option in the top right corner. When you install your database nodes, always use clean and minimal VMs. Existing package dependencies might be removed if required. New packages will be installed and existing packages can be removed when provisioning the node with the required software.

The very first step of the deployment process is to provide ssh credentials appropriate to the hosts on which you are deploying your cluster. As ClusterControl uses password-less ssh to connect to and configure your hosts, an ssh key is required.

ClusterControl deploy MongoDB cluster wizard

It is advisable to use an unprivileged user account to log into the hosts, so a sudo password can be provided to facilitate administrative tasks. If the user account does not prompt for a sudo password, this is not needed. You also have the option to disable iptables and AppArmor or SELinux on the host to avoid the issue with initial deployment.

On the following screen, you can choose to install MongoDB binaries from either MongoDB Inc or from Percona. Here also, you must specify your MongoDB administrative user account and password as user-level security is mandated.

ClusterControl deploy MongoDB wizard, ReplicaSet

On this screen, you can also see which configuration template is being used. ClusterControl uses configuration file templates to ensure repeatable deployments. Templates are stored on the ClusterControl host and can be edited directly using command line, or through the ClusterControl UI. You can also choose to use the vendor repositories, if you wish, or choose your own repository. In addition, you can automatically create a new repository on the ClusterControl host. This allows to freeze the version of MongoDB that ClusterControl will deploy to the current release. Once you carried out the appropriate configuration here, click Deploy to proceed.

Deploy sharding

ClusterControl can also deploy Sharded Clusters. Two methods of doing so are supported. First, you can convert an existing MongoDB ReplicaSet into a Sharded Cluster, as shown below.

ClusterControl Deploy MongoDB shards

When “Convert to Shard” is clicked, you are prompted to add at least one Config server (for production environments, you should add three), and a router, also known as a “mongos” process. The final stage is to choose your MongoDB configuration templates for config server and router, as well as your data directory. Finally, click deploy. When complete, it will show up in your Database Clusters view. It will show your shard health instead of individual instances. It is also possible to add additional shards as needed.

Convert to shard

If you happen to run into scaling issues you can scale this ReplicaSet by either adding more secondaries or scaling out by sharding. You can convert an existing ReplicaSet into a sharded cluster, but this is a long process where you could easily make errors. In ClusterControl we have automated this process, where we automatically add the Config servers, shard routers and enable sharding.

To convert a ReplicaSet into a sharded cluster, you can simply trigger it via the actions drop down:

ClusterControl Convert to shard

Schedule backup policy

It is essential to keep the backup of your database and that your database has a good and easy process for backup. ClusterControl has support for fully consistent backup and restores of your MongoDB replica set or sharded cluster.

Backups can be taken manually or can be scheduled. The centralization of backups is supported, with backups stored either on the Controller filesystem, including network-mounted directories or uploaded to a pre-configured Cloud provider - currently supported providers are Google Cloud Platform, Amazon Web Services and Microsoft Azure. This allows you to take full advantage of advanced lifecycle management functionality provided by Amazon and Google for such features as custom retention schedules, long-term archival, and encryption at rest, among others.

Backup retention is configurable; you can choose to retain your backup for any time period or to never delete backups. AES256 encryption is employed to secure your backups against rogue elements.

For rapid recovery, backups can be restored directly into the backup cluster - ClusterControl handles the full restore process from launch to cluster recovery, removing error-prone manual steps from the process.

Enable operational reports

With ClusterControl you can schedule cross environment reports like "Daily System Report,""Package Upgrade Report,""Schema Change Report" as well as "Backups" and "Availability." These reports will help you keep your environment secure and operational. You will also see recommendations on how to fix gaps. Reports in HTML format can be emailed to SysOps, DevOps or even managers who would like to get regular status updates about a given system’s health.

Performance Advisors

Advisors provide specific advice on how to address issues in areas such as performance, security, log management, configuration, storage space, and others. ClusterControl comes with a list of pre-defined advisors that are intended to track the state of different metrics and state of your databases. When needed, an alert is created.They can be extended with manual scripts. For more information please follow our recent blog on “How to Automate Database Workload Analysis with ClusterControl Performance Advisors”.

Among various operating system performance advisor, you can find the below related to MongoDB.

MongoDBsharding advisors
connections used
replication check
replication window

Deploy in the cloud

Starting in version 1.6, ClusterControl enables you to create a MongoDB 3.4 ReplicaSets in the cloud. The supported cloud platforms are Amazon AWS, Google Cloud and Microsoft Azure.

The wizard will walk you through the VM machine creation and MongoDB settings, all in one place.

ClusterControl deploy MongoDB ReplicaSet in cloud

The process let’s you choose OS parameters including network setup. There is no need to copy SSH keys, they will be added automatically. After the job is done, you will see your cluster in the main dashboard. From now on, you can manage your MongoDB cluster like any other in ClusterControl.

ClusterControl deploy MongoDb RelicaSet in cloud, VM network settings

Security Tips

At this point your new cluster should be up and running. Before you allow users and application processes to access data, you need to define cluster security settings. In our previous blogs, we raised concerns about default security configuration. Here are some of the main things you need to consider before you pass your new cluster to other teams.

Change default ports - by default, MongoDB will bind to standard ports: 27017 for MongoDB ReplicaSets or Shard Routers, 27018 for shards and 27019 for Config servers. Using standard ports is not recommended as it simplifies the possibility of a hacker attack.

Enable authentication - without authentication, users can login without password. Enable authentication on all your environments (development, certification and production).

security:
    Authentication: on

Use strong passwords - if needed, use a password generator to generate complex passwords.

Add replicaton key file - with the keyfile enabled, the authentication of the replication stream will be encrypted.

Encrypt your backups - ClusterControl enables you to encrypt your backups.

For further reading, we have a blog on how to secure MongoDB.

Enable cluster auto recovery

The last but not least feature to enable would be node and cluster auto recovery.

ClusterControl can work for you as an extended 24/7 DBA team member. There are two main functions here. Automatic node recovery and automatic cluster recovery.

When node auto recovery is enabled ClusterControl will react to node issues and in the case of failures, it will attempt to recover individual nodes. This is to address things like a process that runs of memory or service that requires a start after a power outage, whatever is causing an issue with the service down.

The cluster recovery option is even more sophisticated. It will perform a switchover if needed.

In that case, rolling back any changes that are not replicated to the slaves will be placed in a ‘rollback’ folder, so it is up to the administrator to restore it.

To setup node and cluster auto recovery, you just need to enable them in the main dashboard.

Viewing all 286 articles
Browse latest View live