Quantcast
Channel: Severalnines - MongoDB
Viewing all 286 articles
Browse latest View live

Become a ClusterControl DBA: Performance and Health Monitoring

$
0
0

In the previous two blog posts we covered both deploying the four types of clustering/replication (MySQL/Galera, MySQL Replication, MongoDB & PostgreSQL) and managing/monitoring your existing databases and clusters. So, after reading these two first blog posts you were able to add your 20 existing replication setups to ClusterControl, expand them and additionally deployed two new Galera clusters while doing a ton of other things. Or maybe you deployed MongoDB and/or PostgreSQL systems. So now, how do you keep them healthy?

That’s exactly what this blog post is about: how to leverage ClusterControl performance monitoring and advisors functionality to keep your MySQL, MongoDB and/or PostgreSQL databases and clusters healthy. So how is this done in ClusterControl?

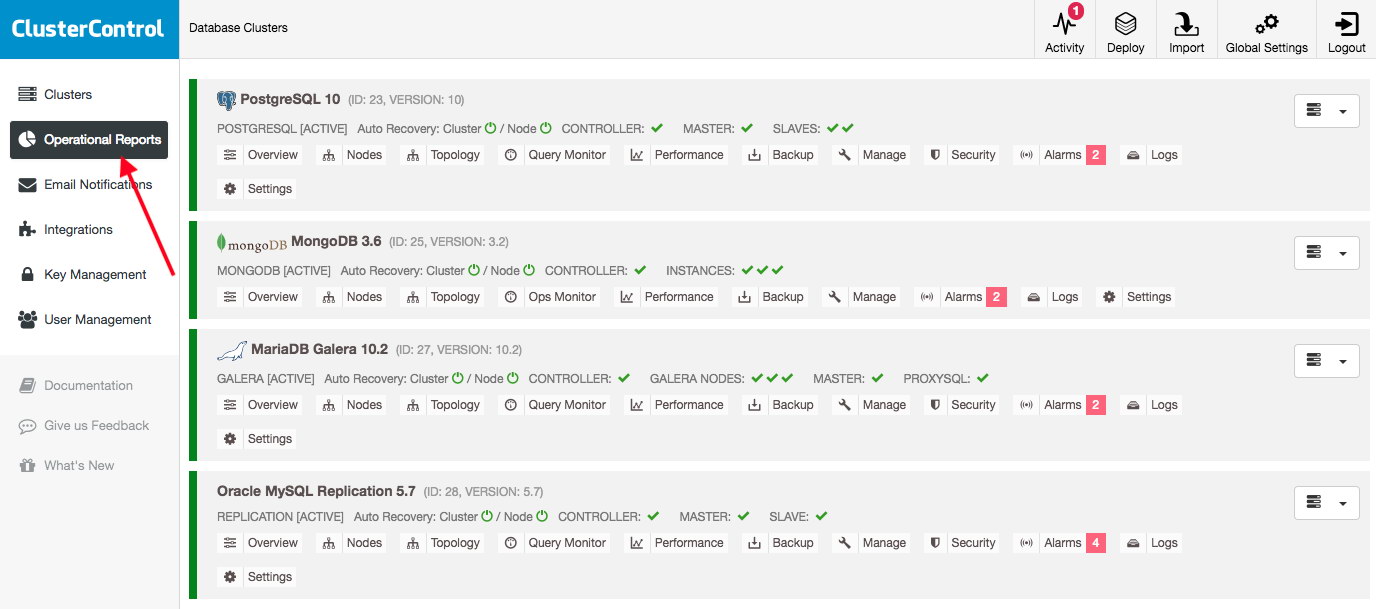
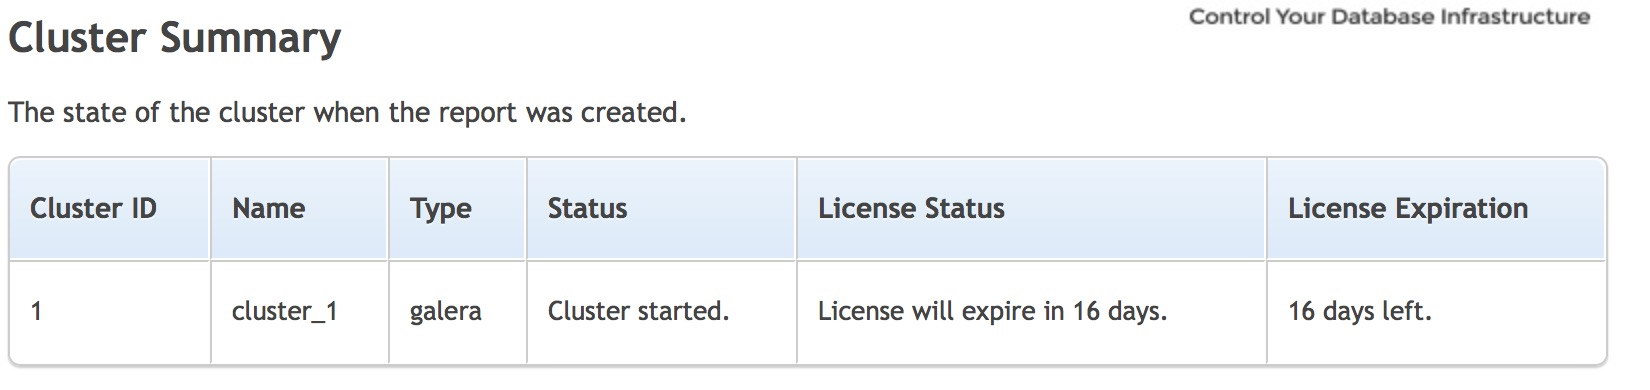
Database Cluster List

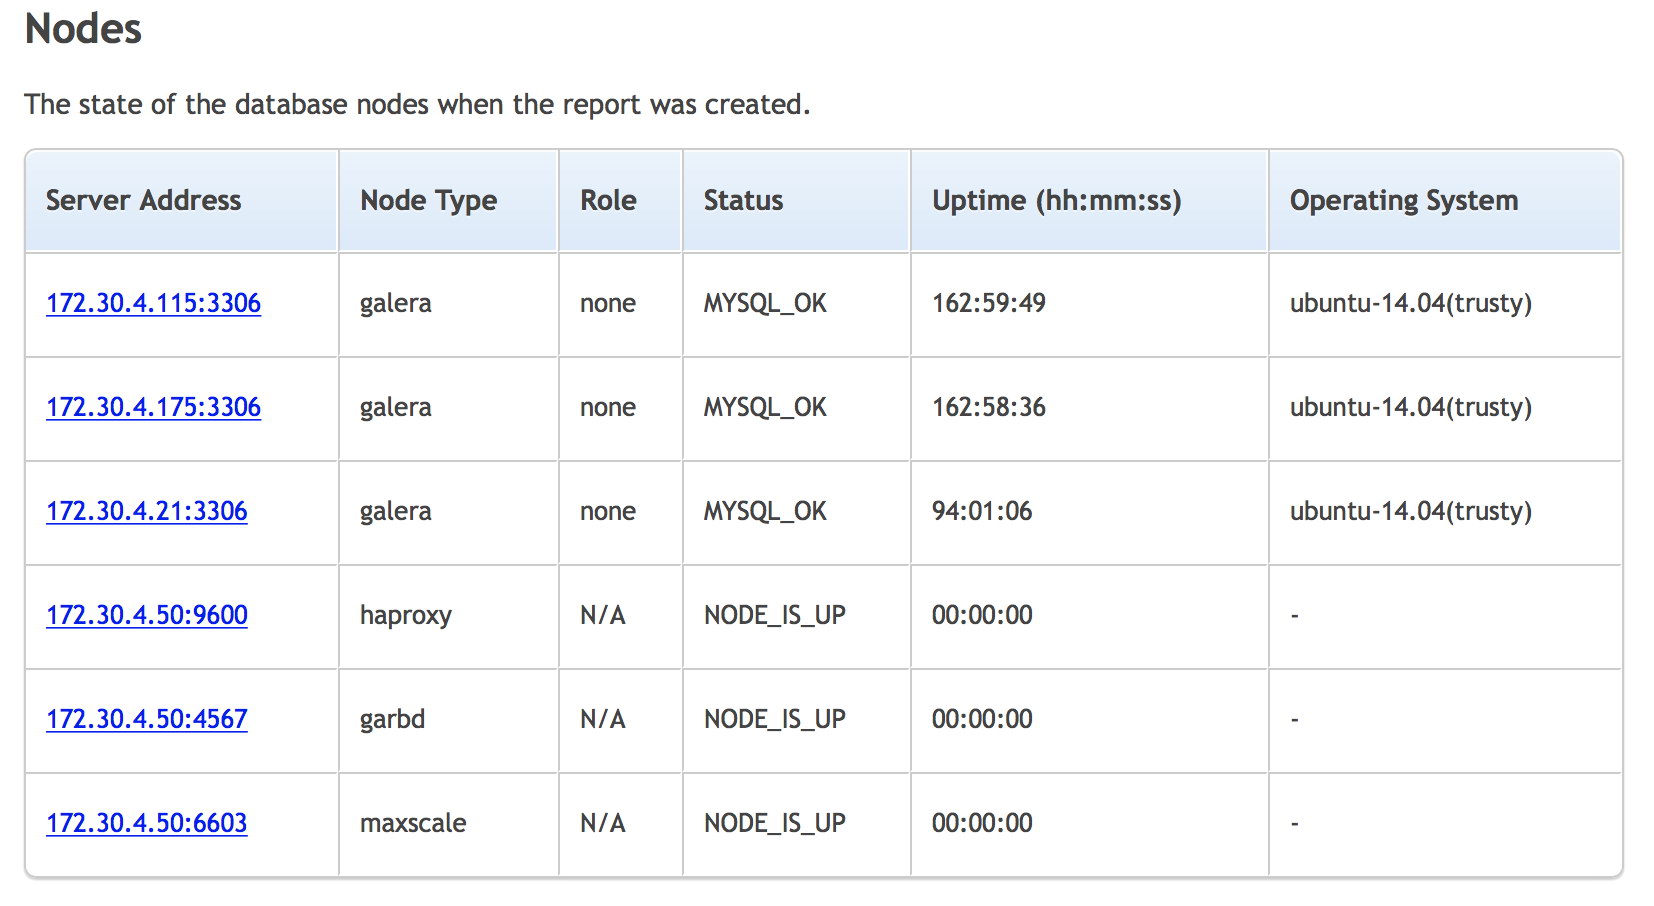
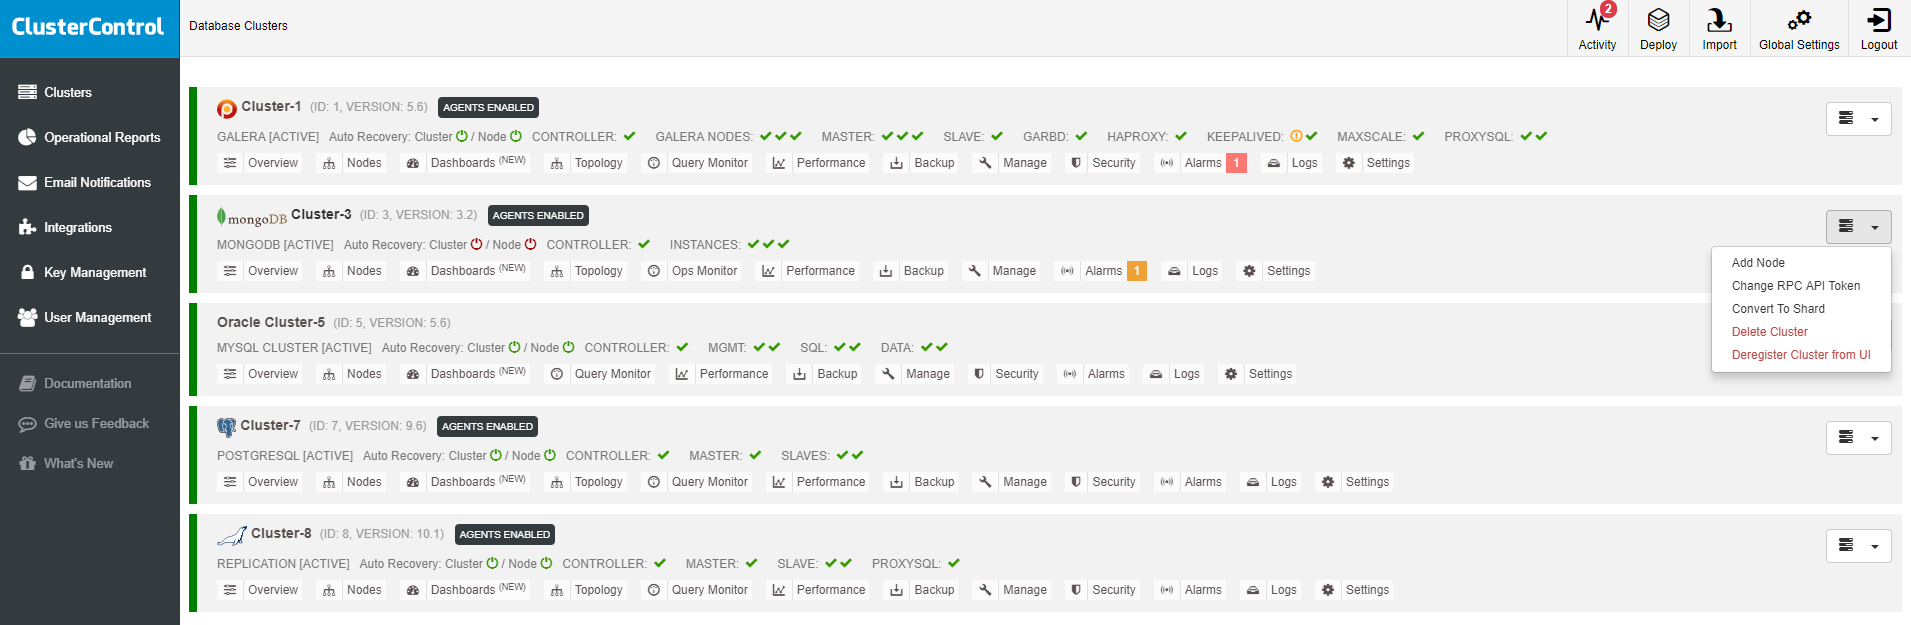
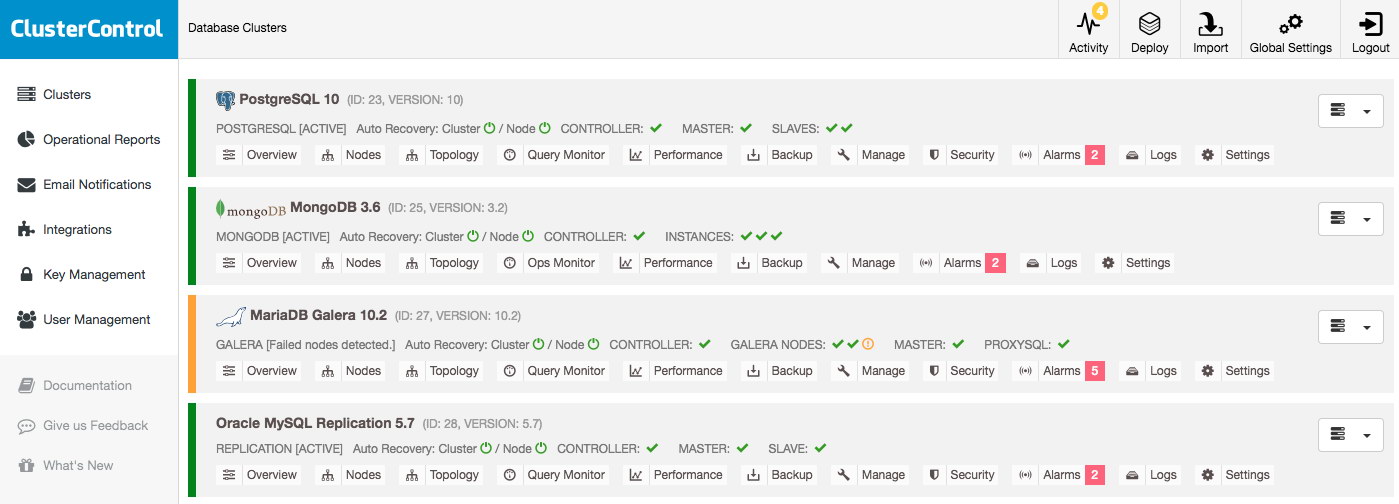
The most important information can already be found in the cluster list: as long as there are no alarms and no hosts are shown to be down, everything is functioning fine. An alarm is raised if a certain condition is met, e.g. host is swapping, and brings to your attention the issue you should investigate. That means that alarms not only are raised during an outage but also to allow you to proactively manage your databases.

Suppose you would log into ClusterControl and see a cluster listing like this, you will definitely have something to investigate: one node is down in the Galera cluster for example and every cluster has various alarms:

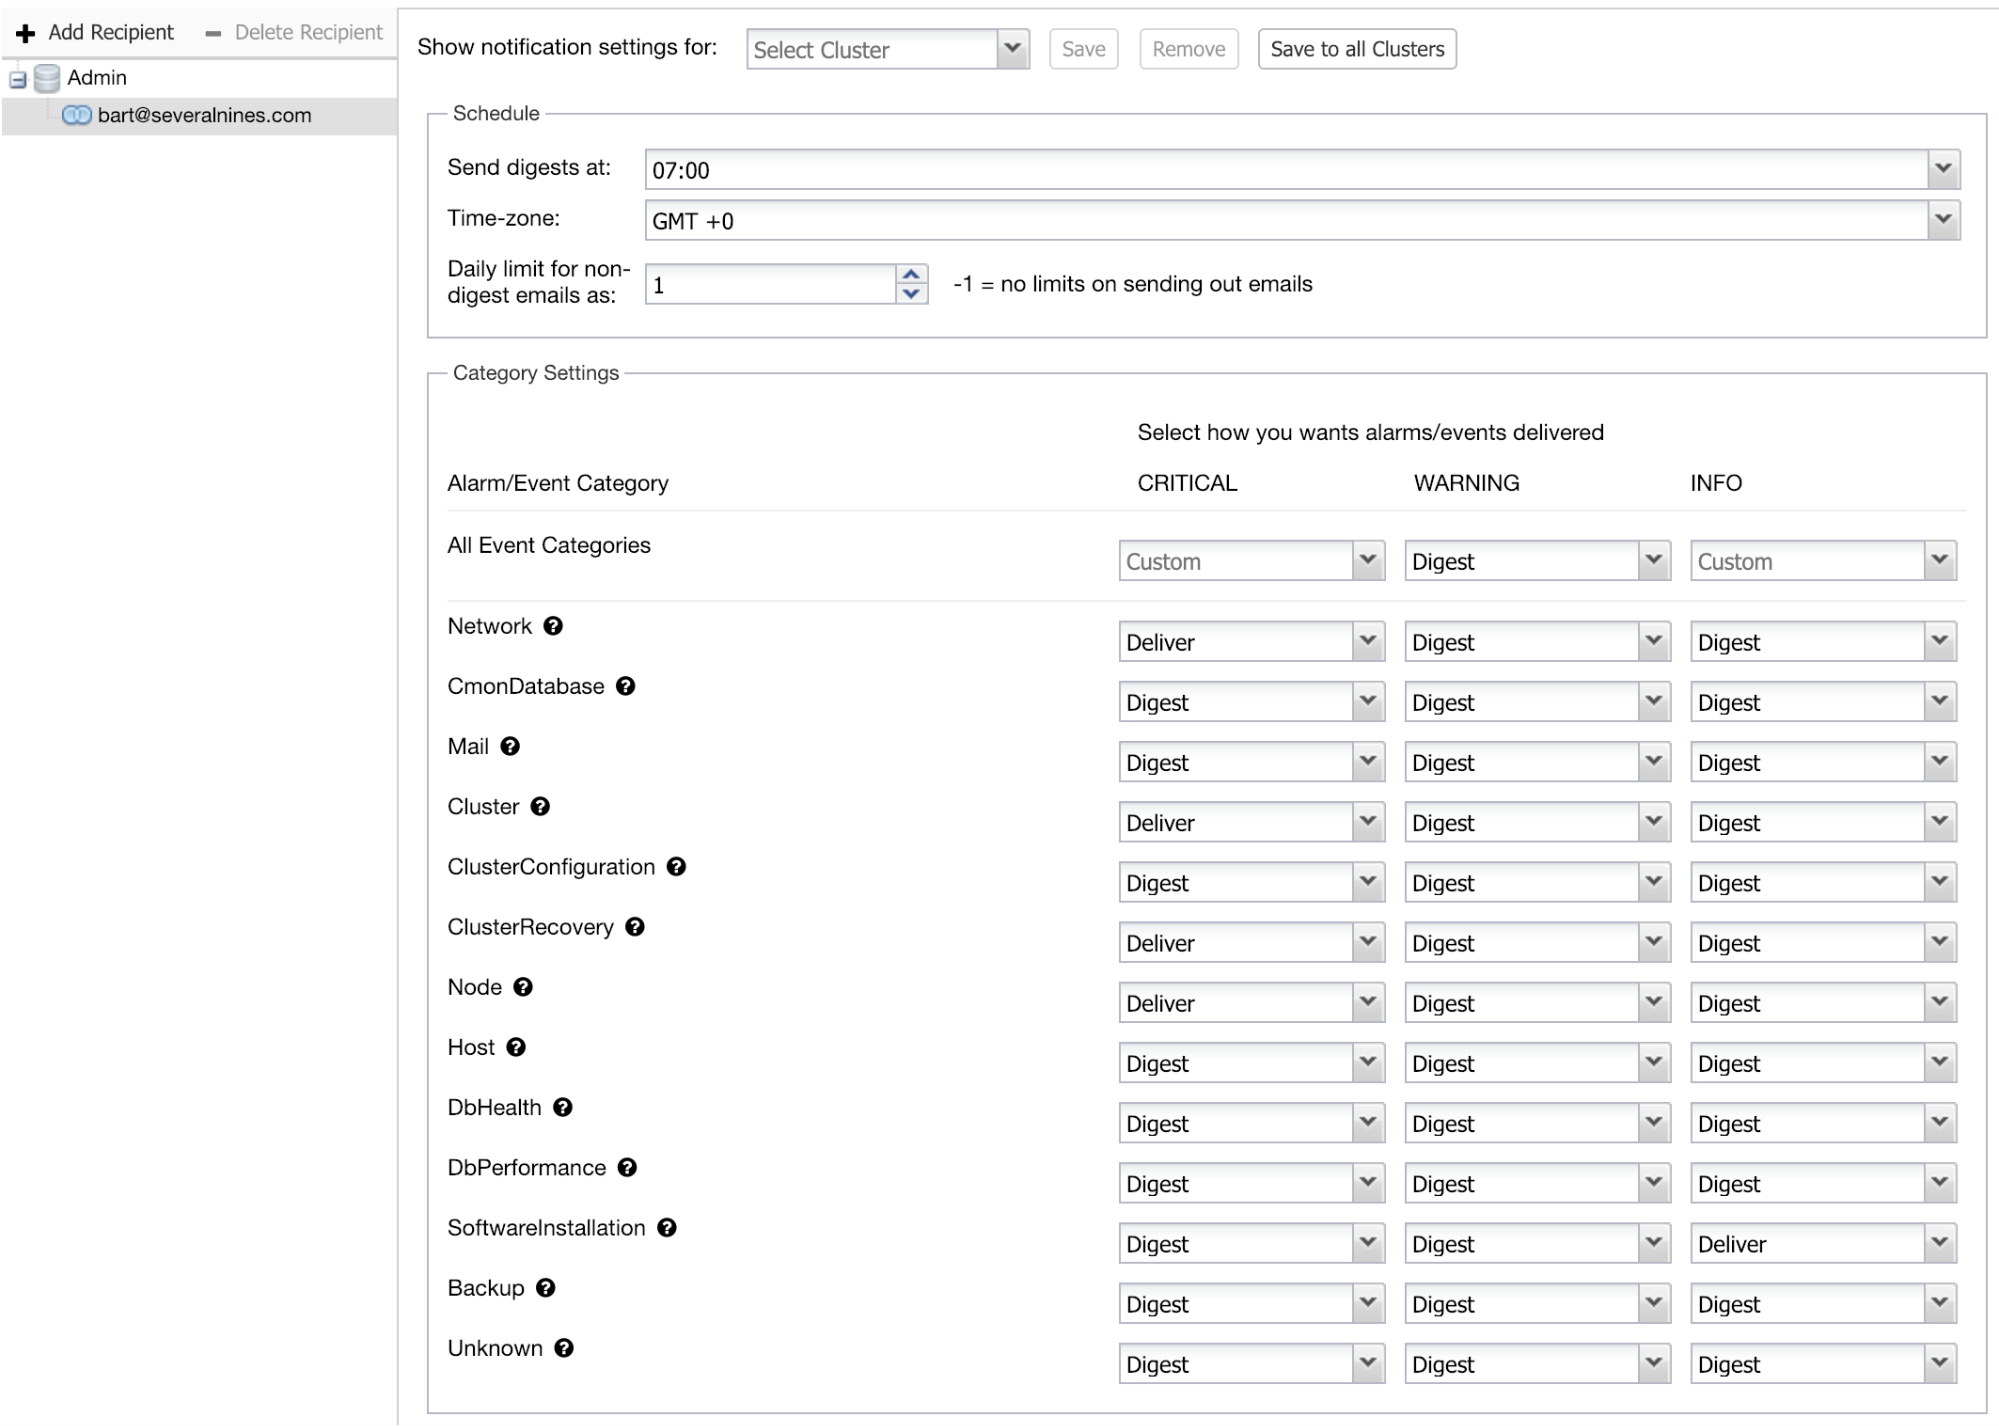
Once you click on one of the alarms, you will go to a detailed page on all alarms of the cluster. The alarm details will explain the issue and in most cases also advise the action to resolve the issue.

You can set up your own alarms by creating custom expressions, but that has been deprecated in favor of our new Developer Studio that allows you to write custom Javascripts and execute these as Advisors. We will get back to this topic later in this post.

Cluster Overview - Dashboards

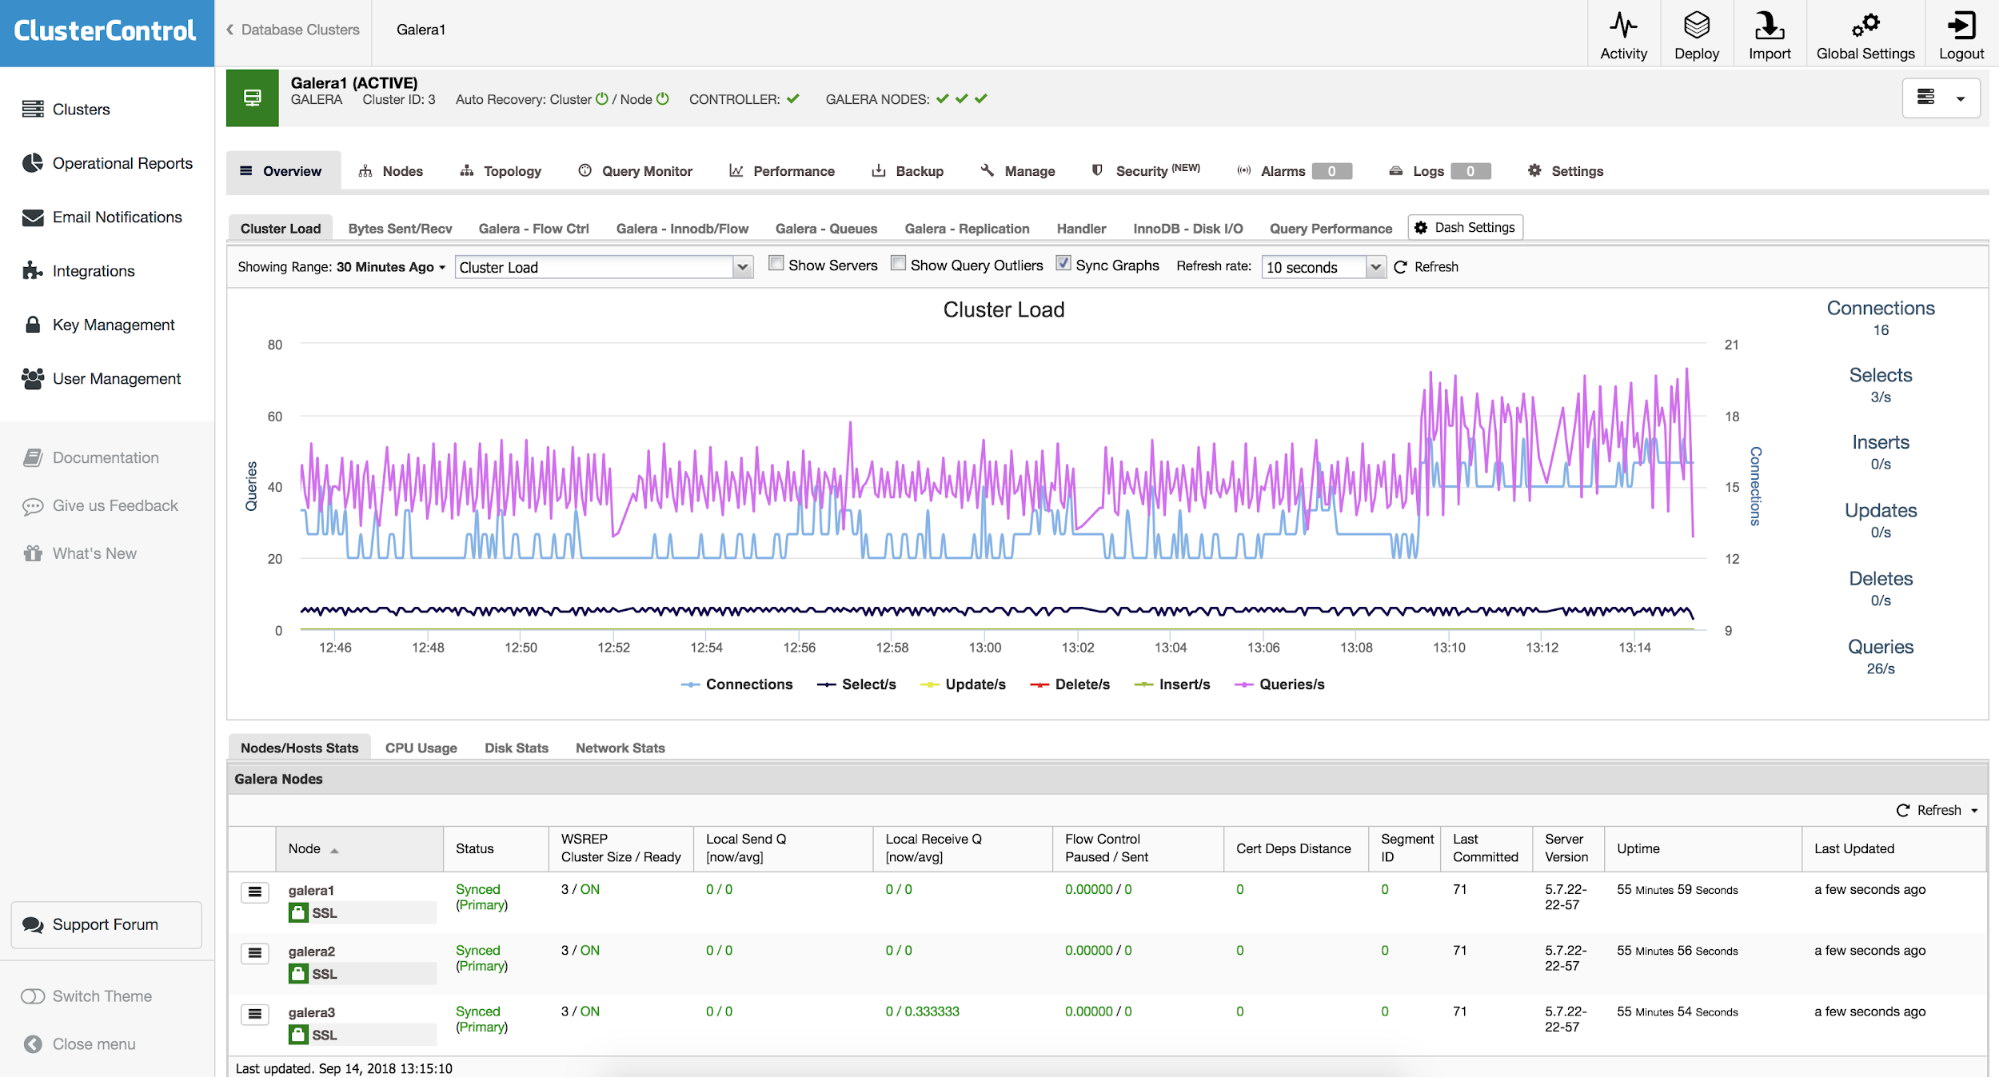
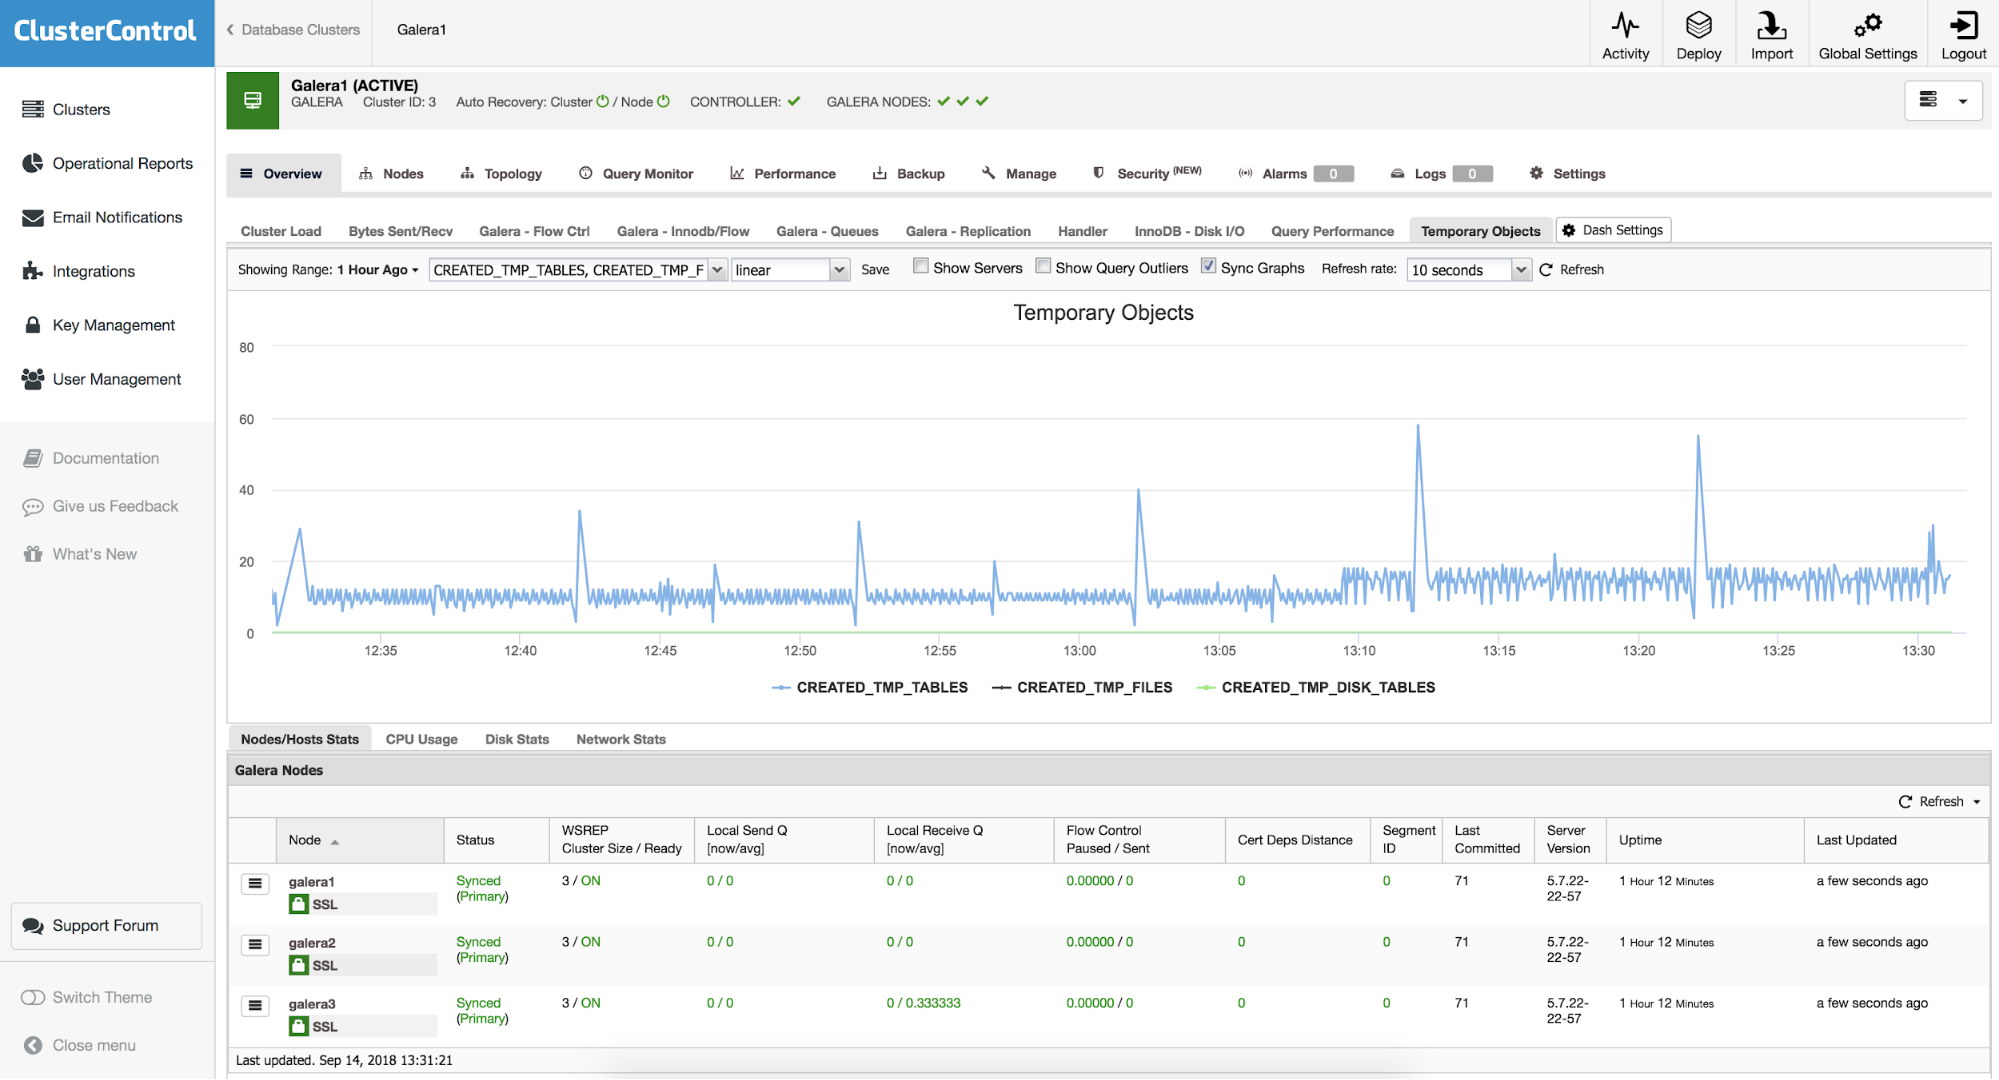
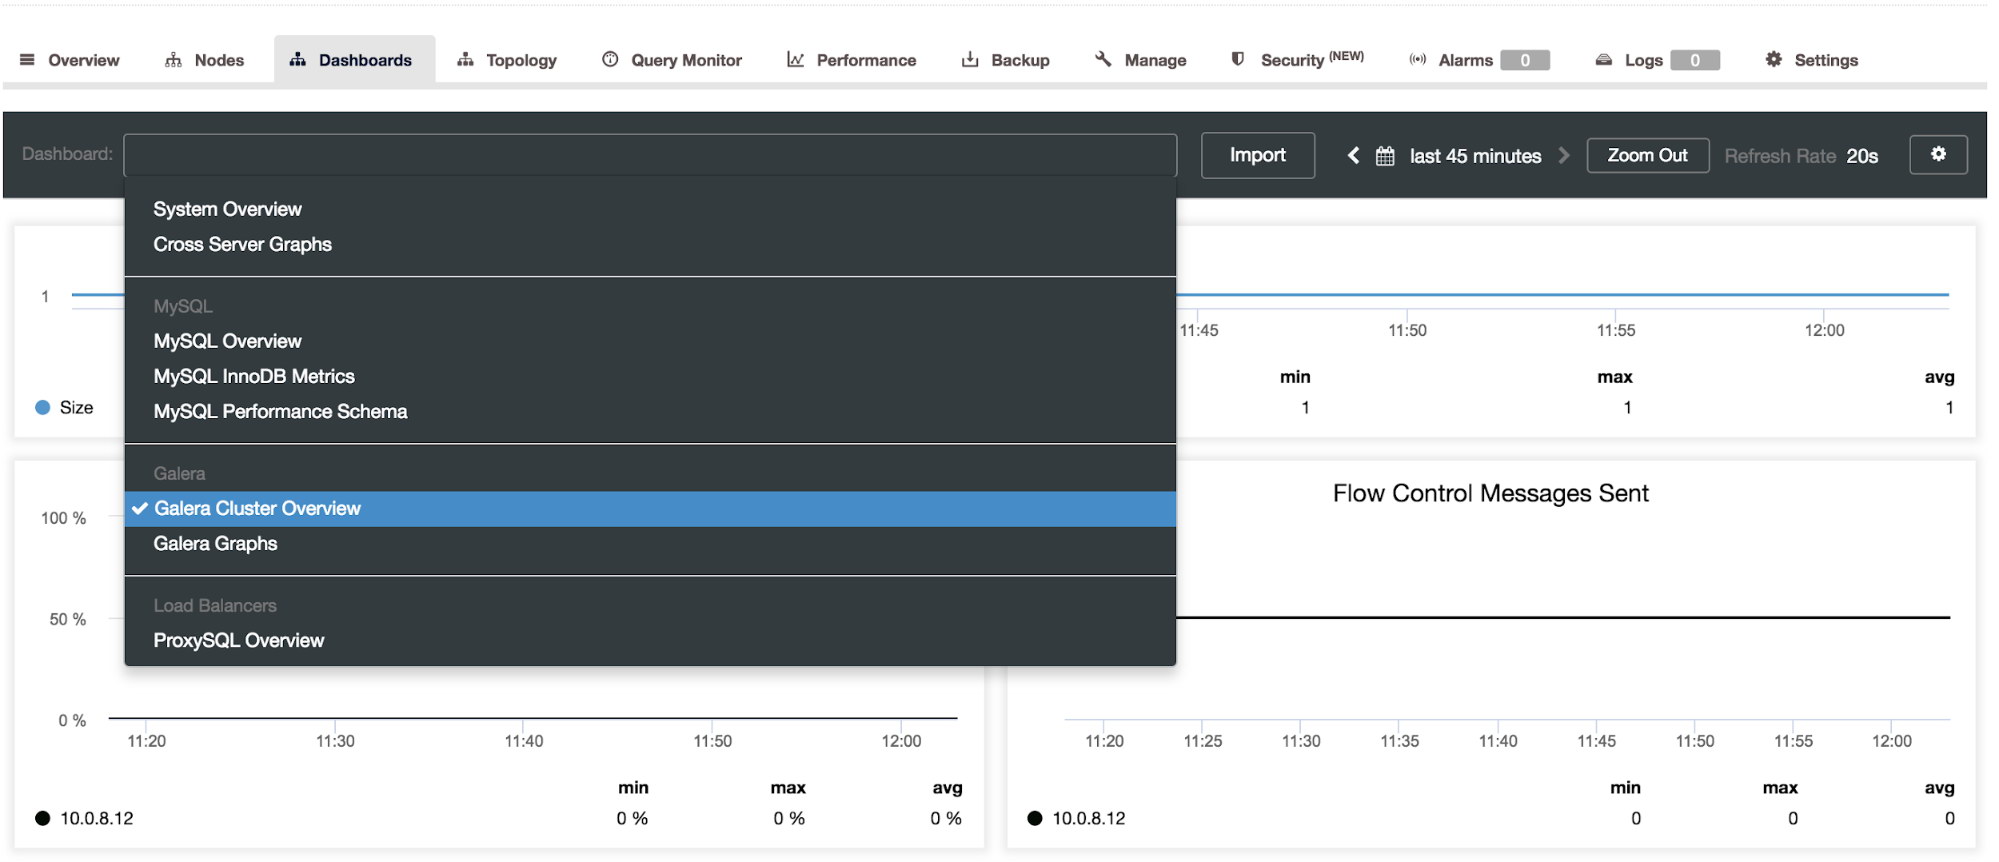
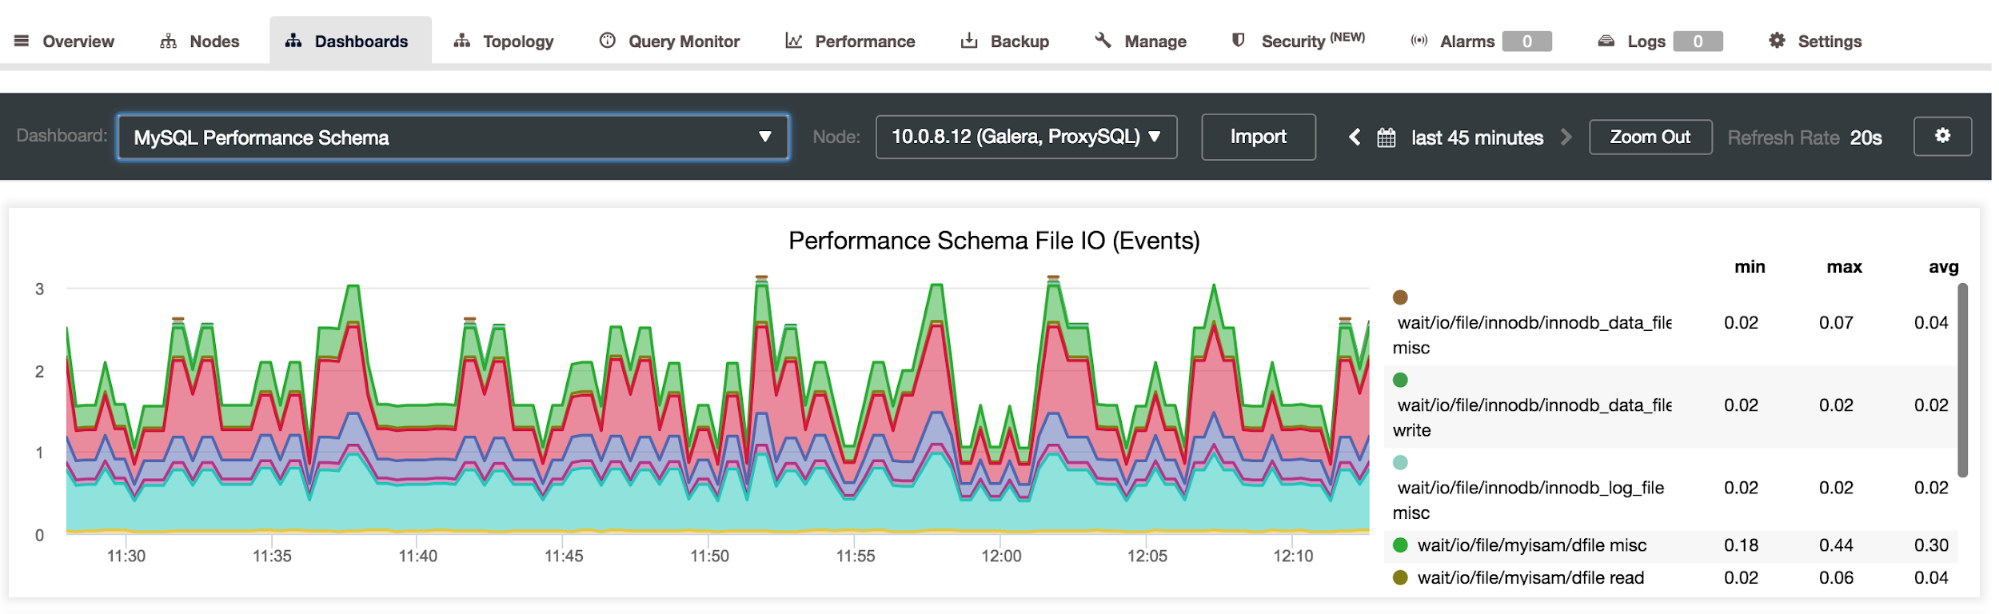
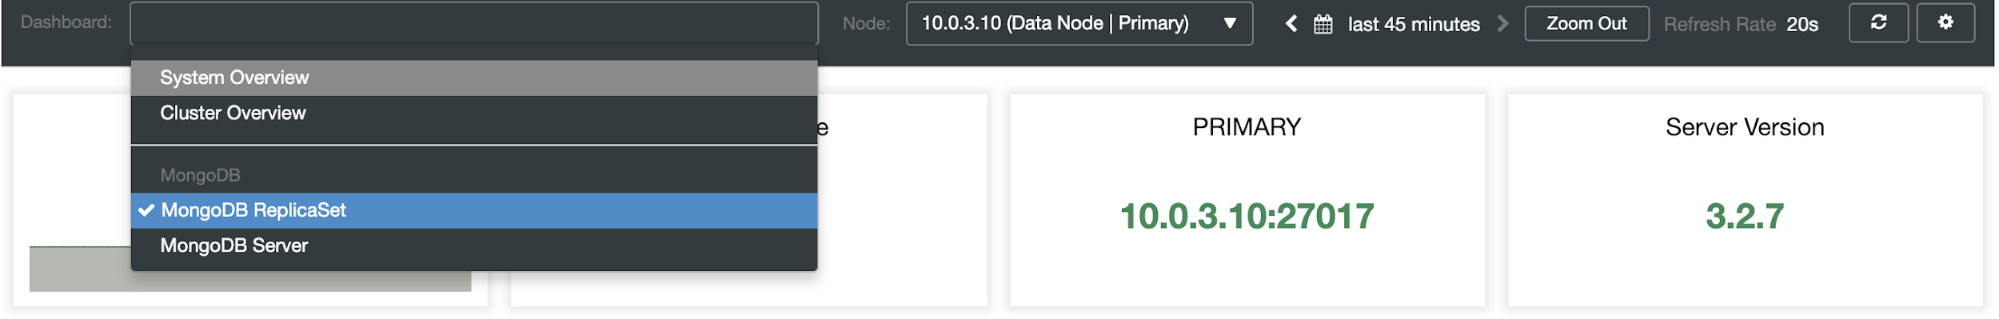
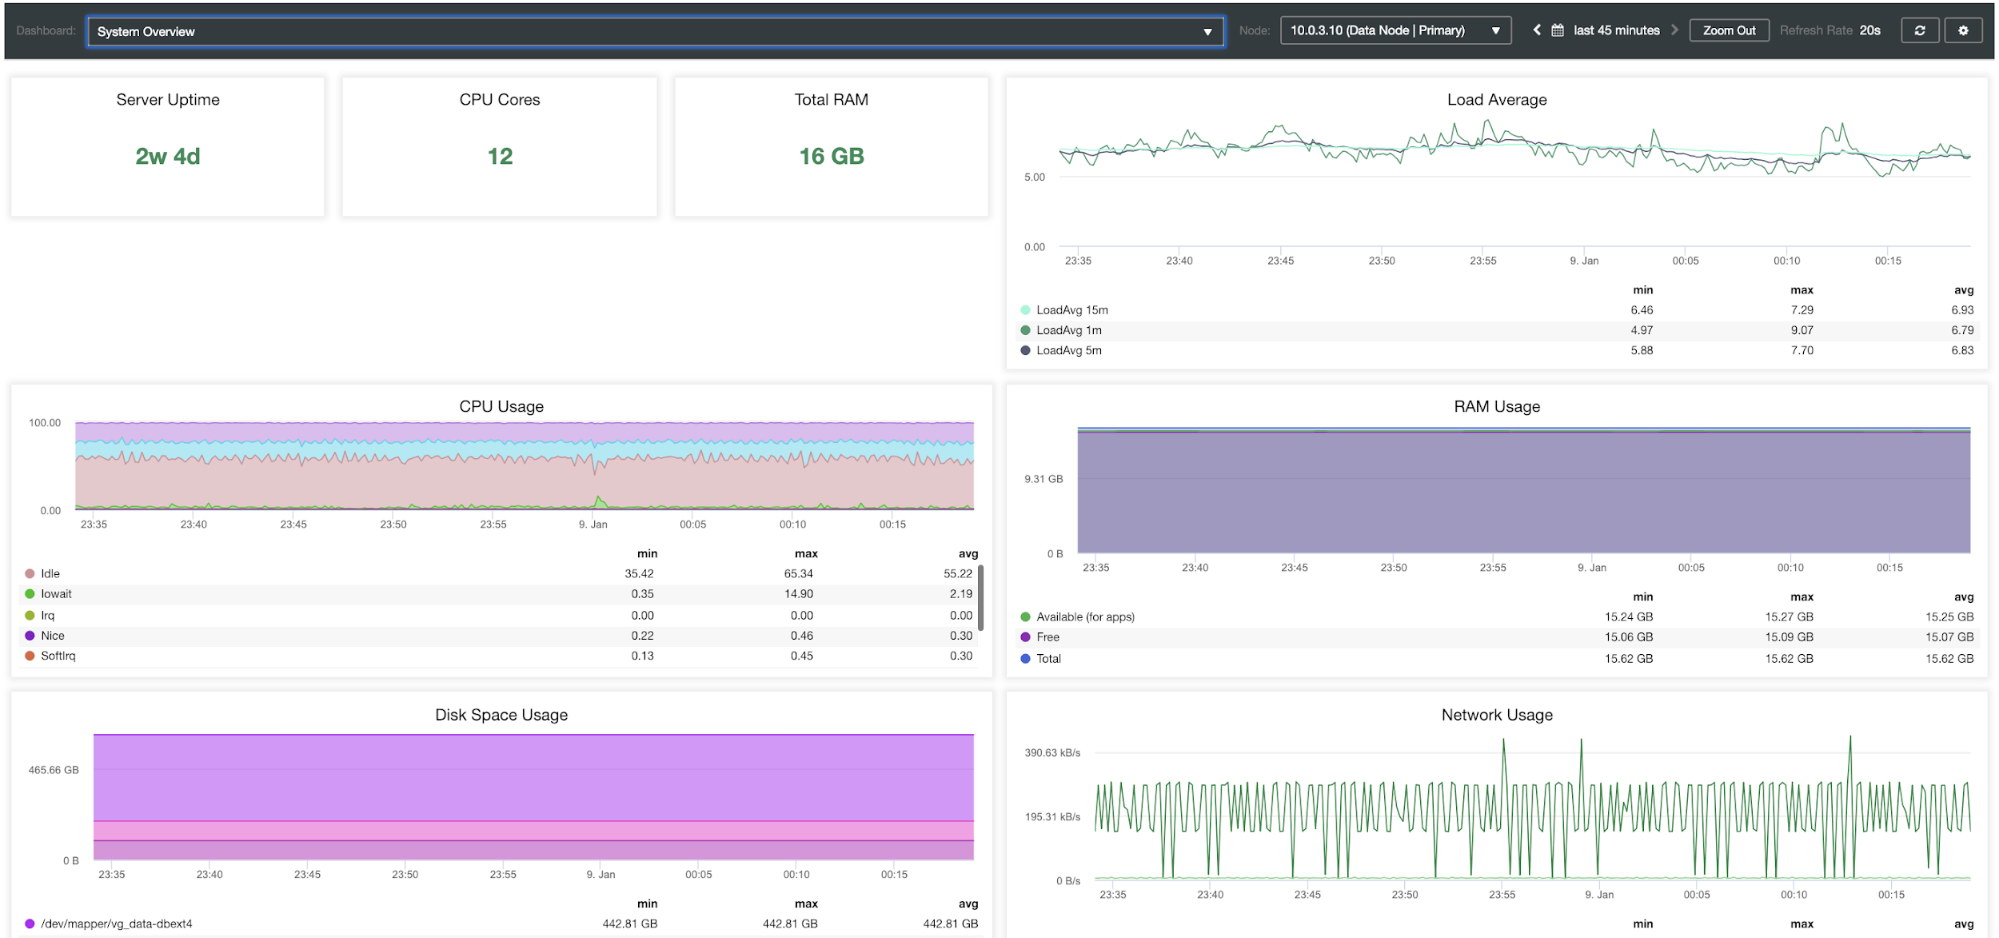
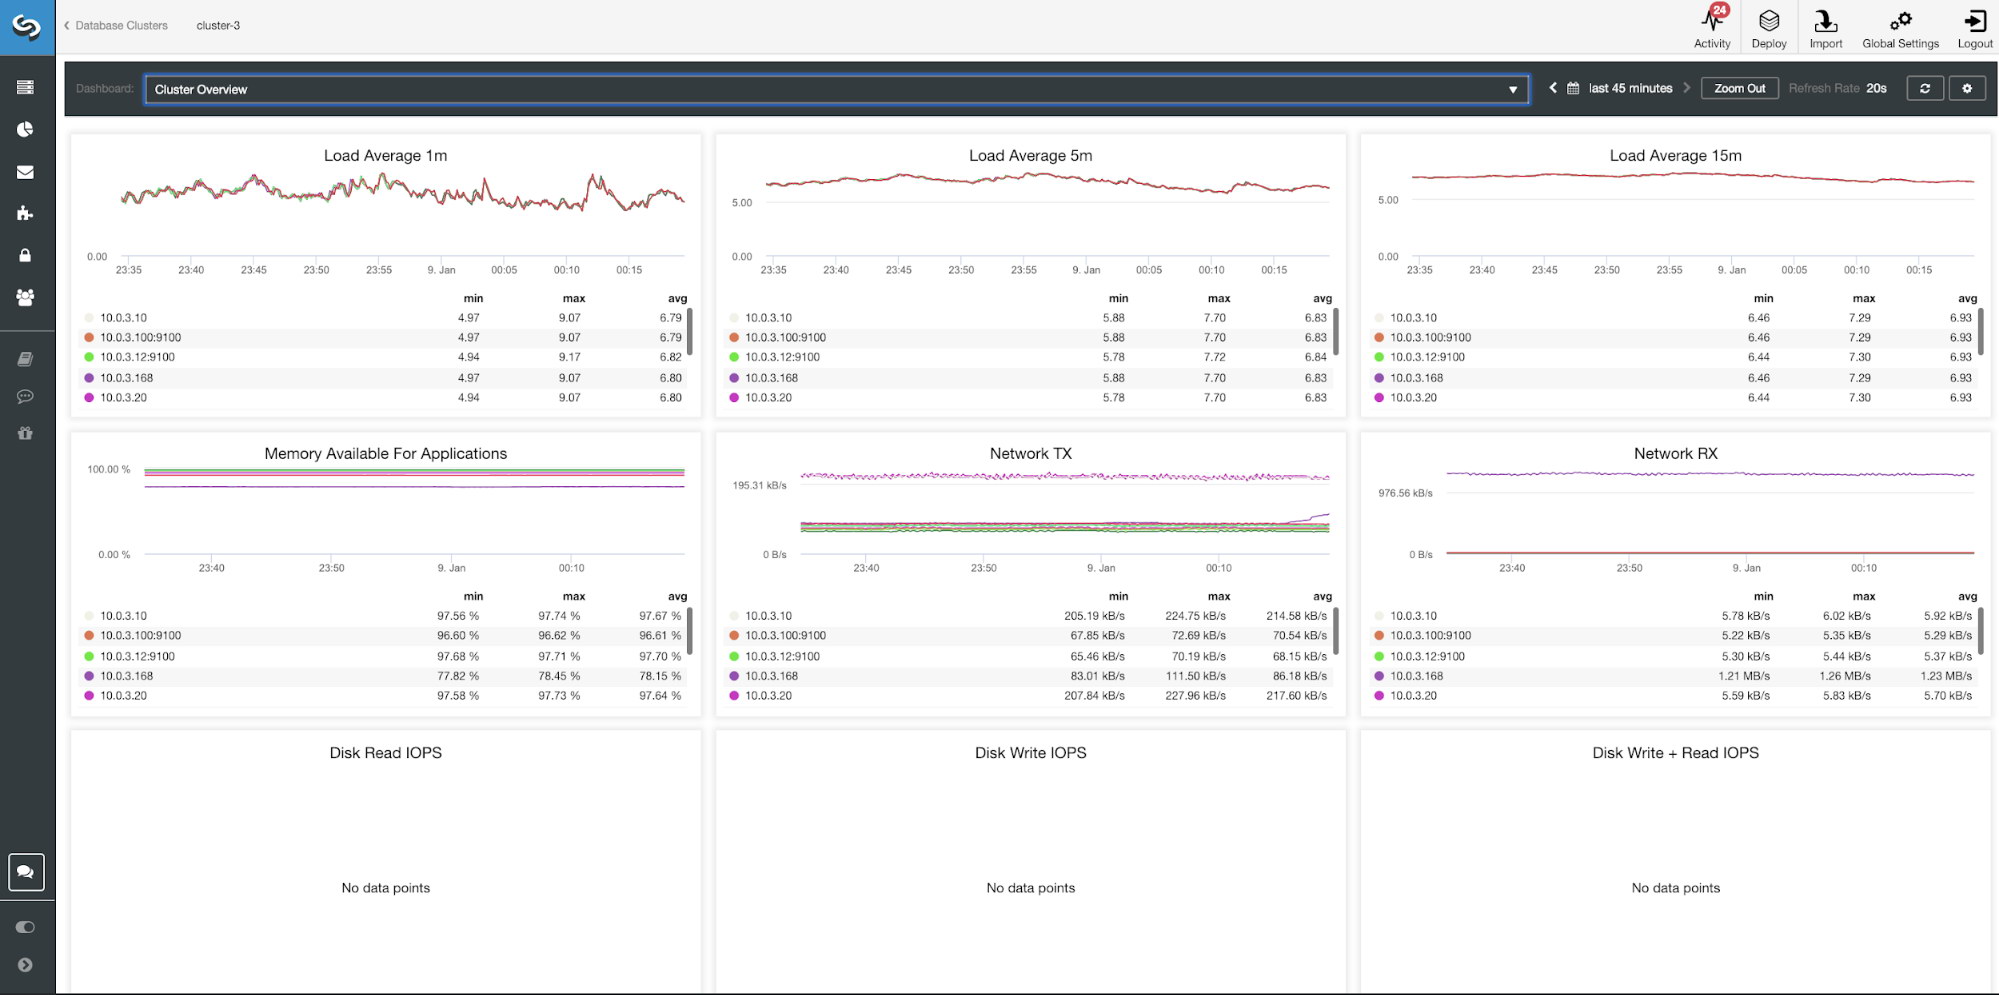
When opening up the cluster overview, we can immediately see the most important performance metrics for the cluster in the tabs. This overview may differ per cluster type as, for instance, Galera has different performance metrics to watch than traditional MySQL, PostgreSQL or MongoDB.

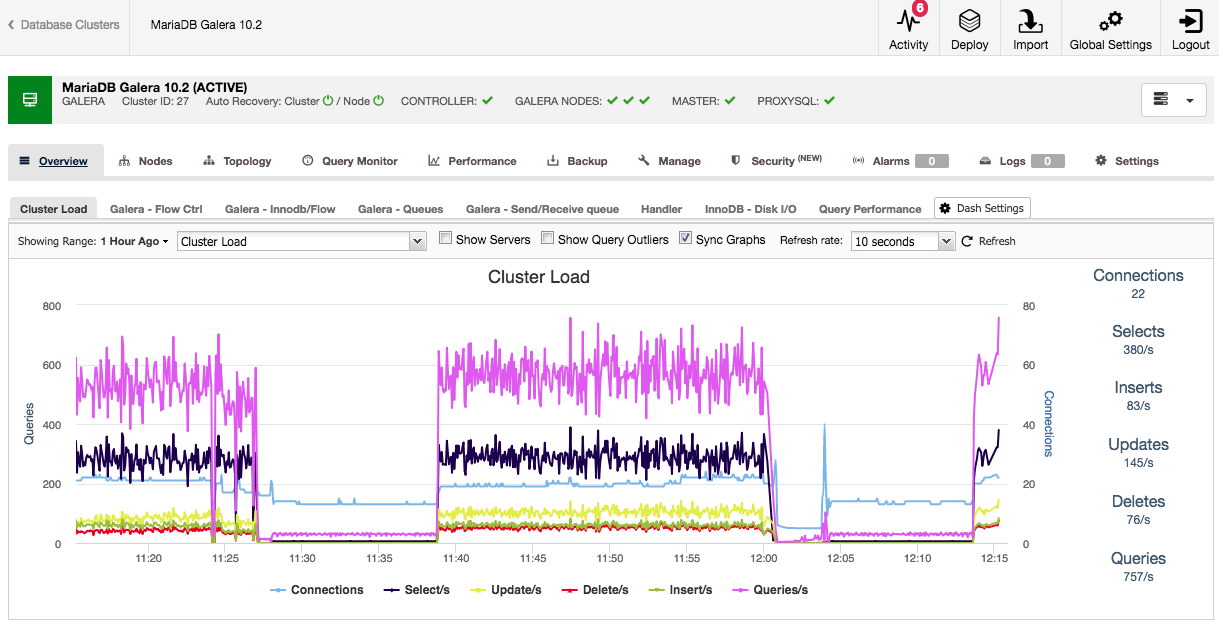
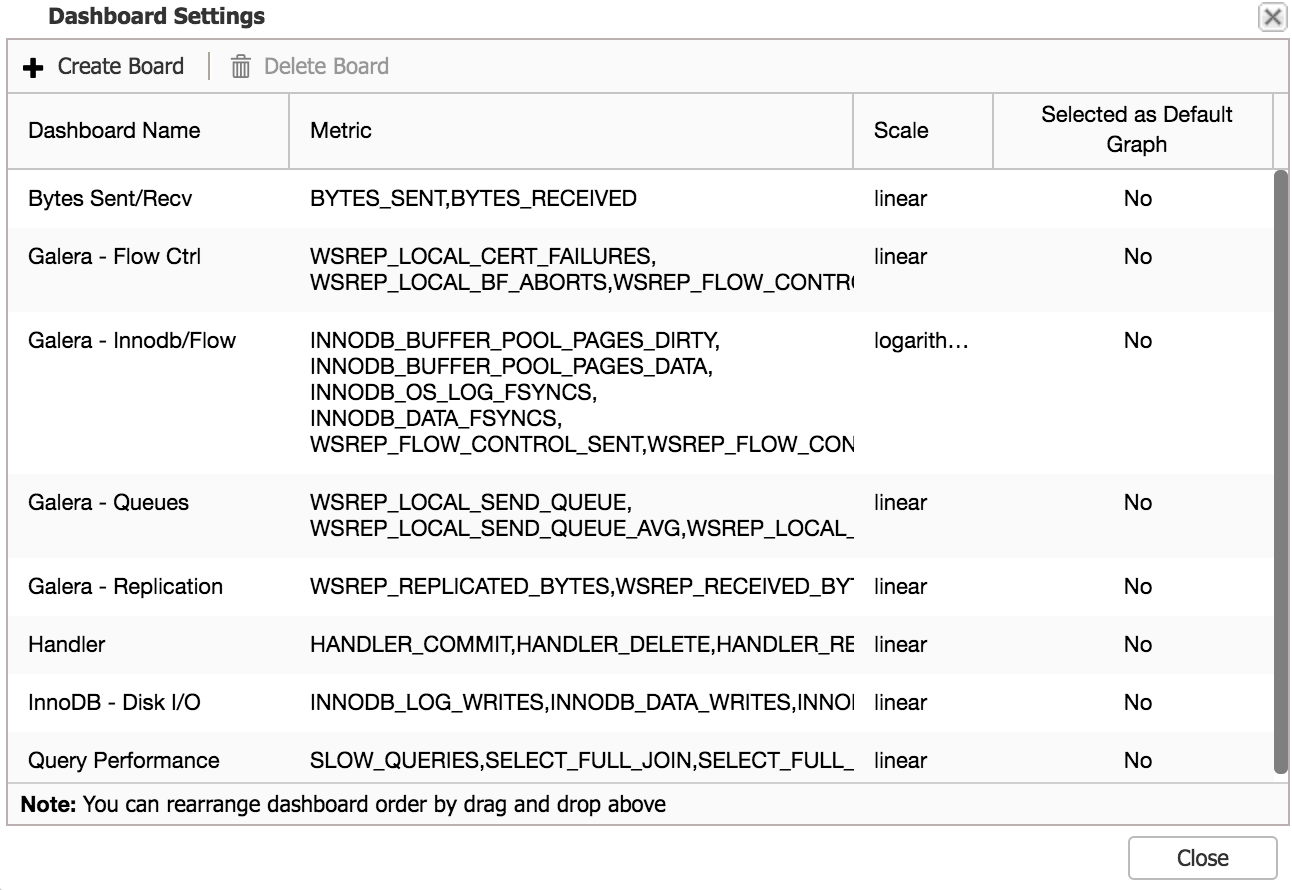
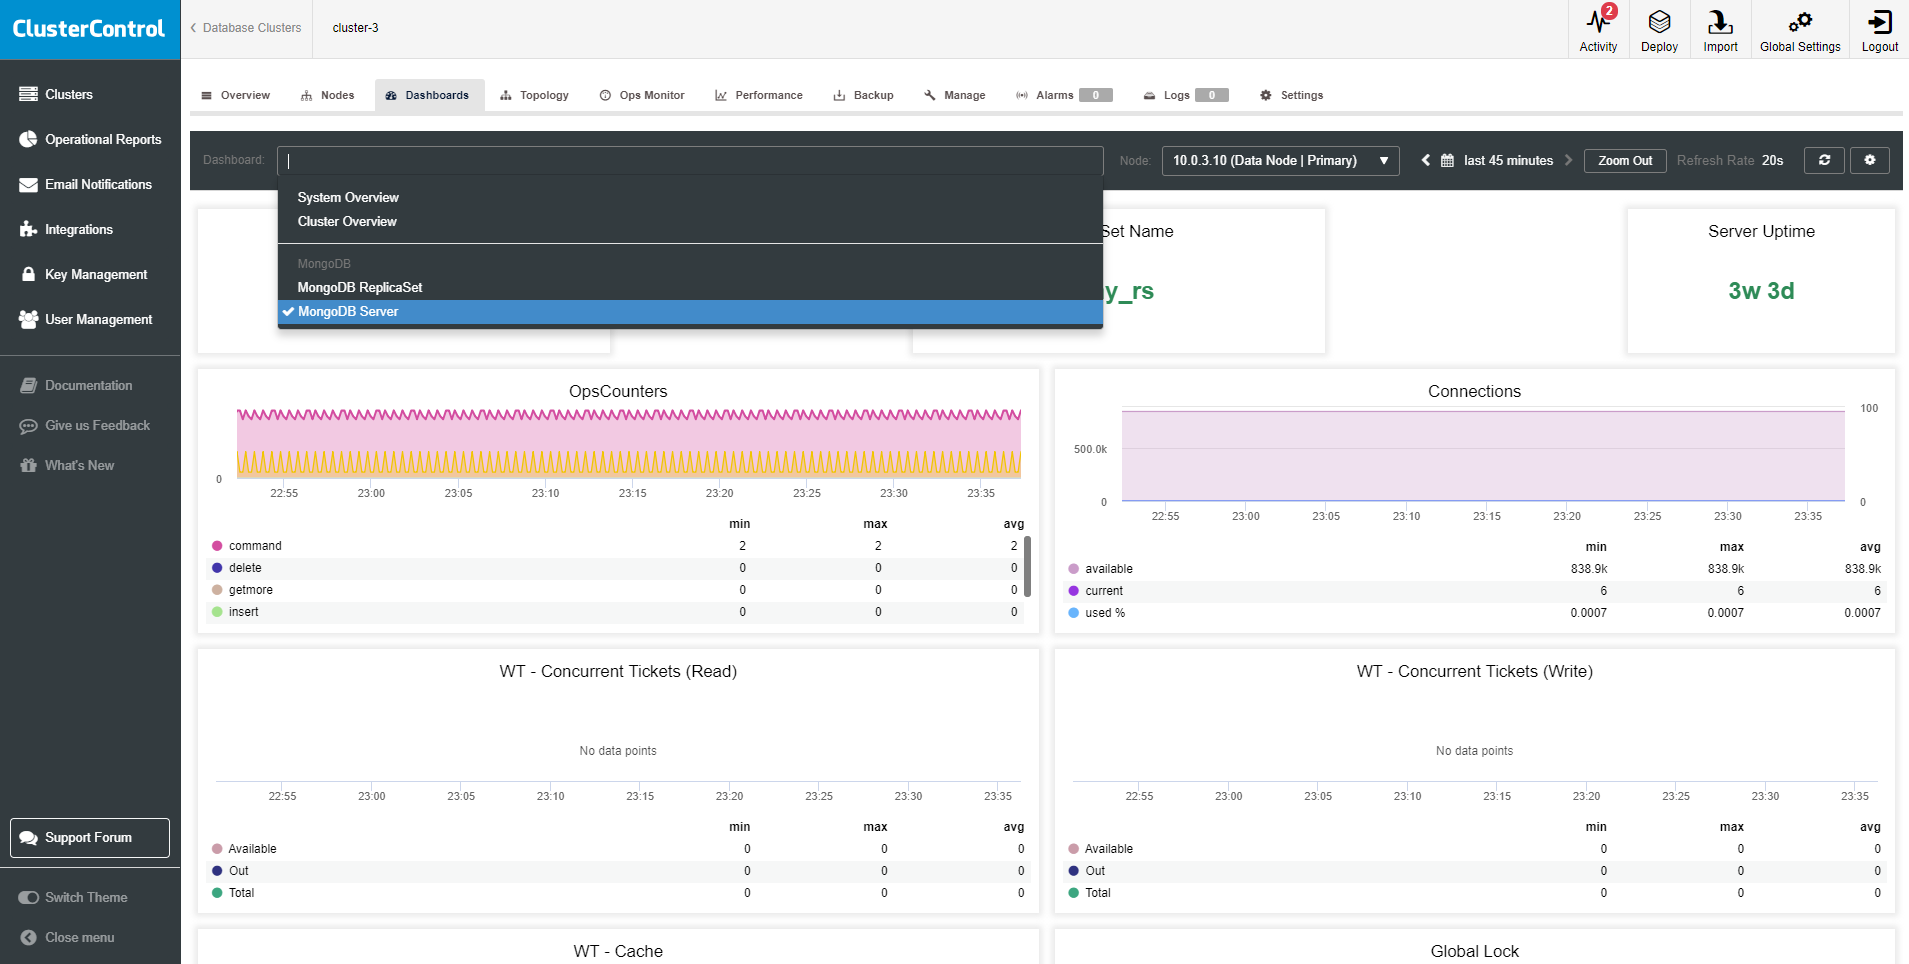
Both the default overview and the pre-selected tabs are customizable. By clicking on Overview -> Dash Settings you are given a dialogue that allows you to define the dashboard:

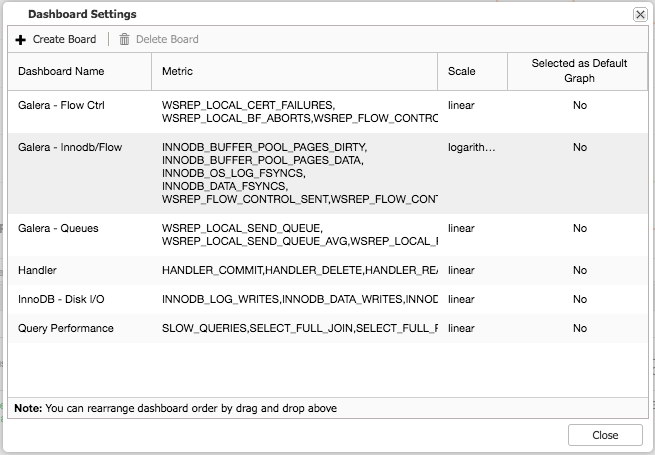
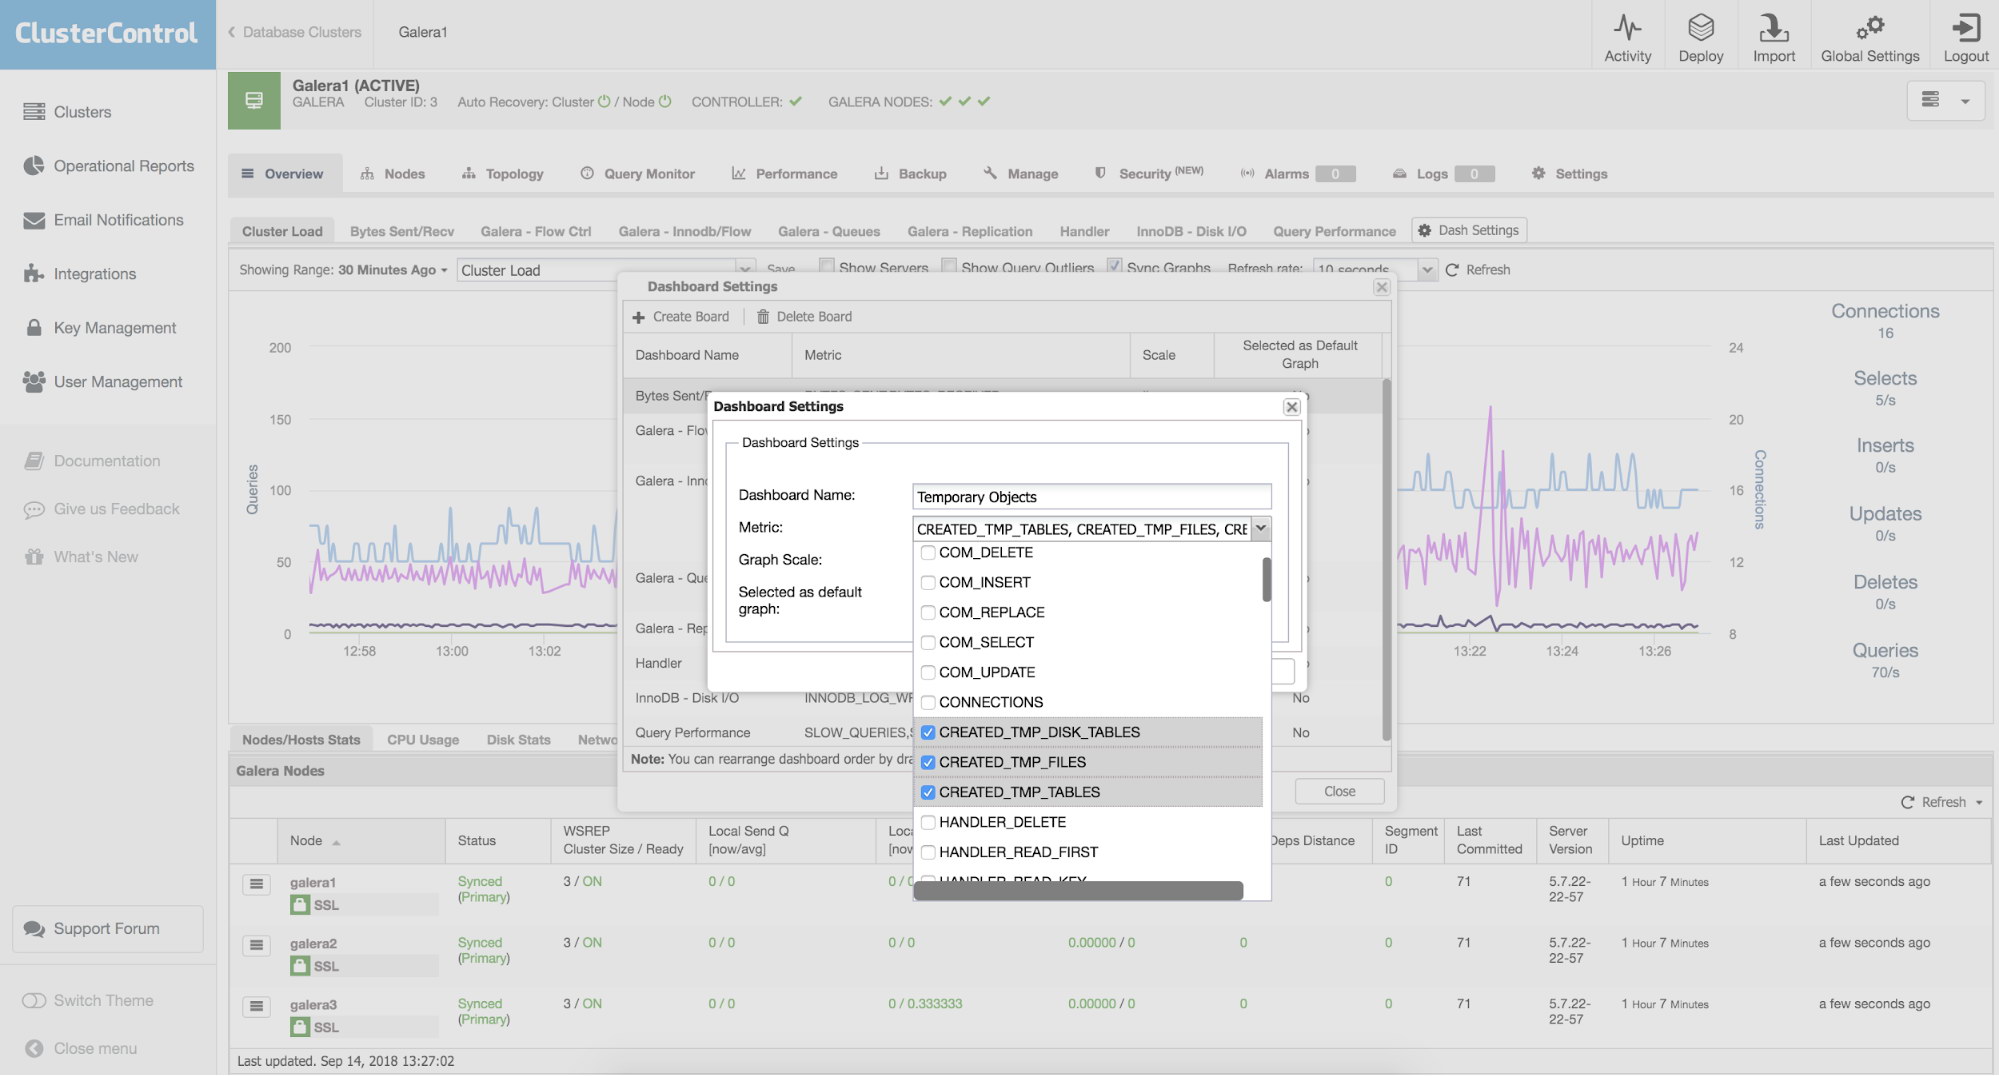
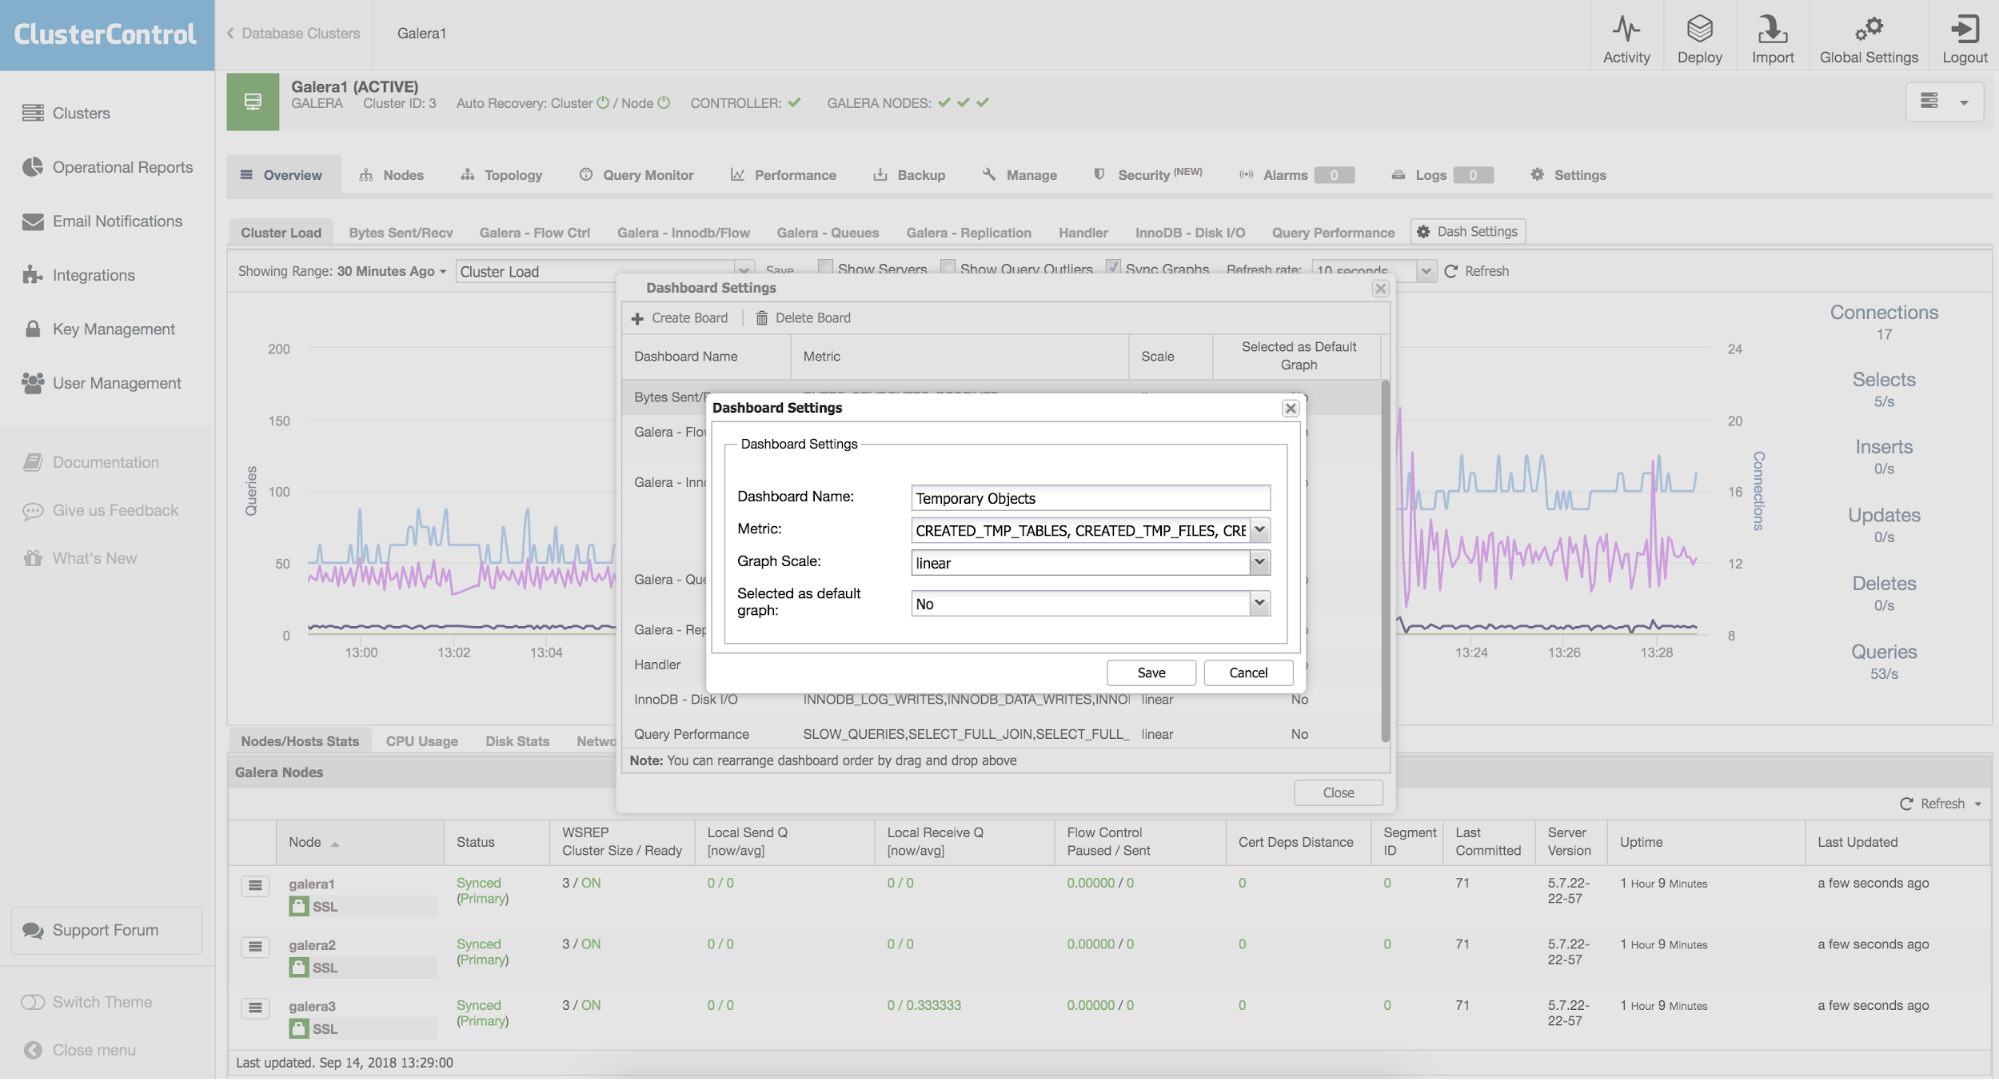
By pressing the plus sign you can add and define your own metrics to graph the dashboard. In our case we will define a new dashboard featuring the Galera specific send and receive queue average:

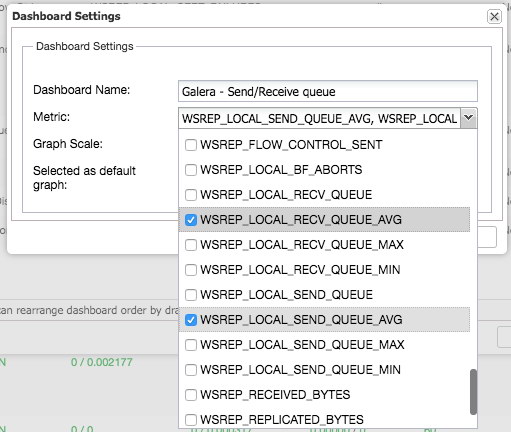
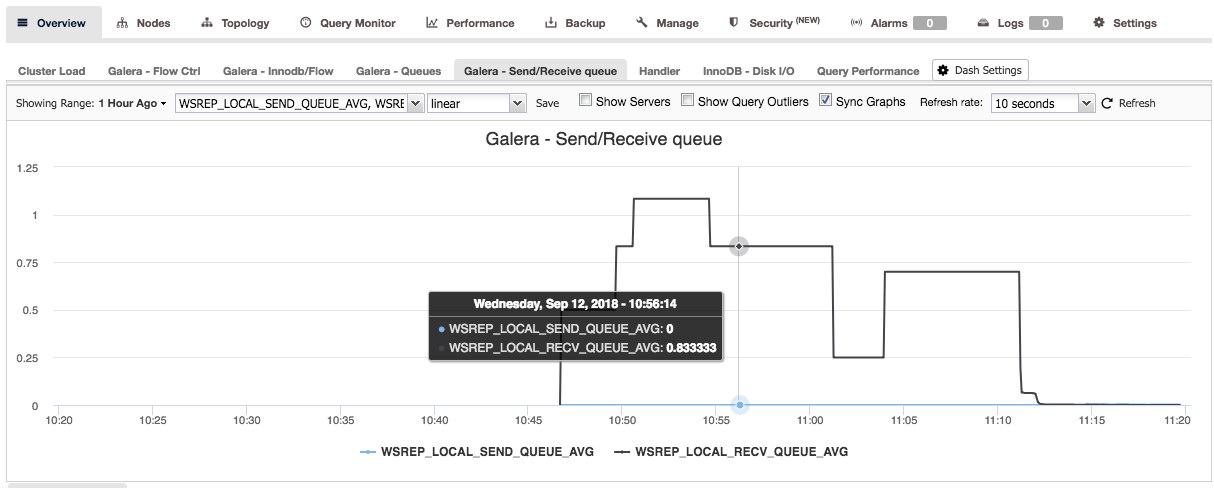
This new dashboard should give us good insight in the average queue length of our Galera cluster.

Once you have pressed save, the new dashboard will become available for this cluster:

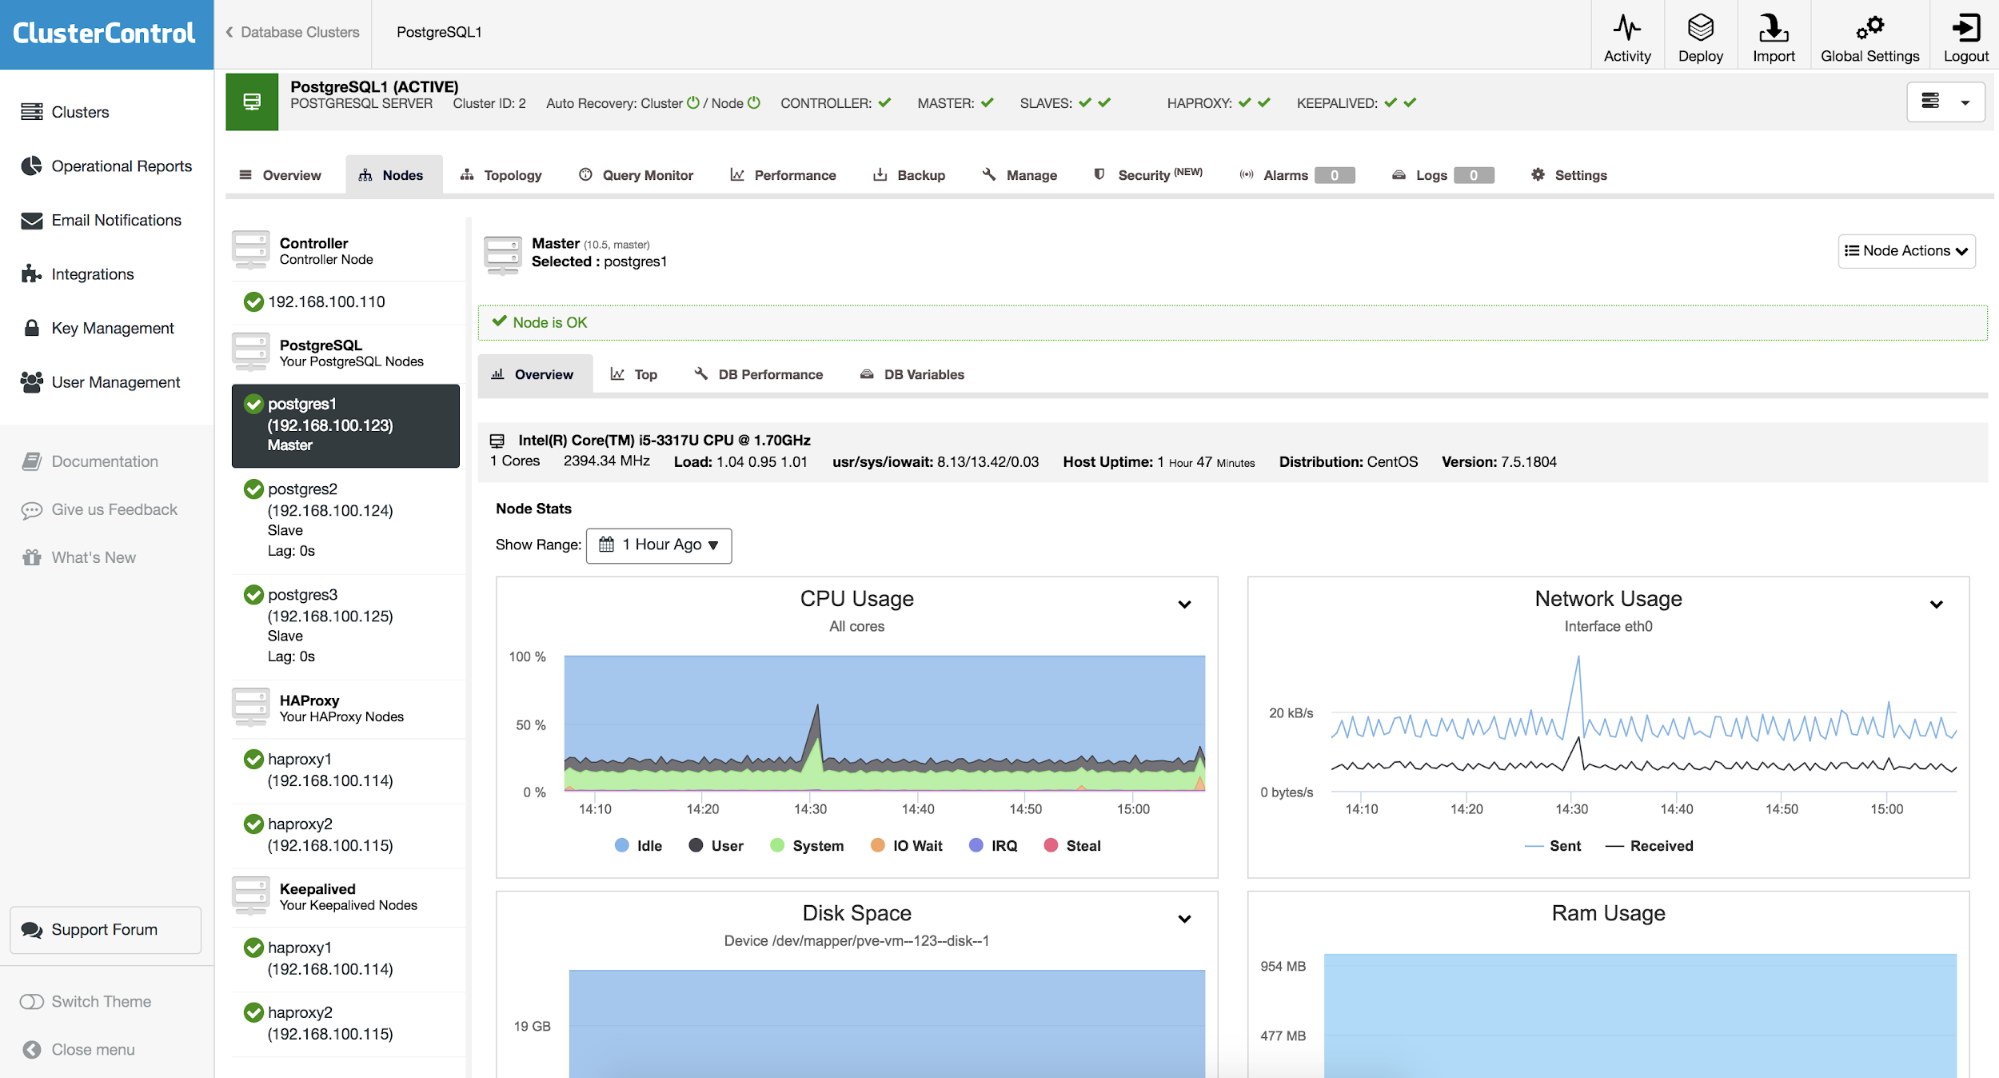
Similarly you can do this for PostgreSQL as well, for example we can monitor the shared blocks hit versus blocks read:

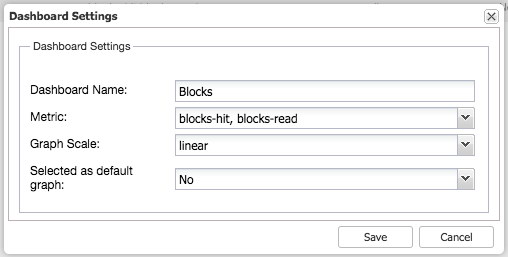
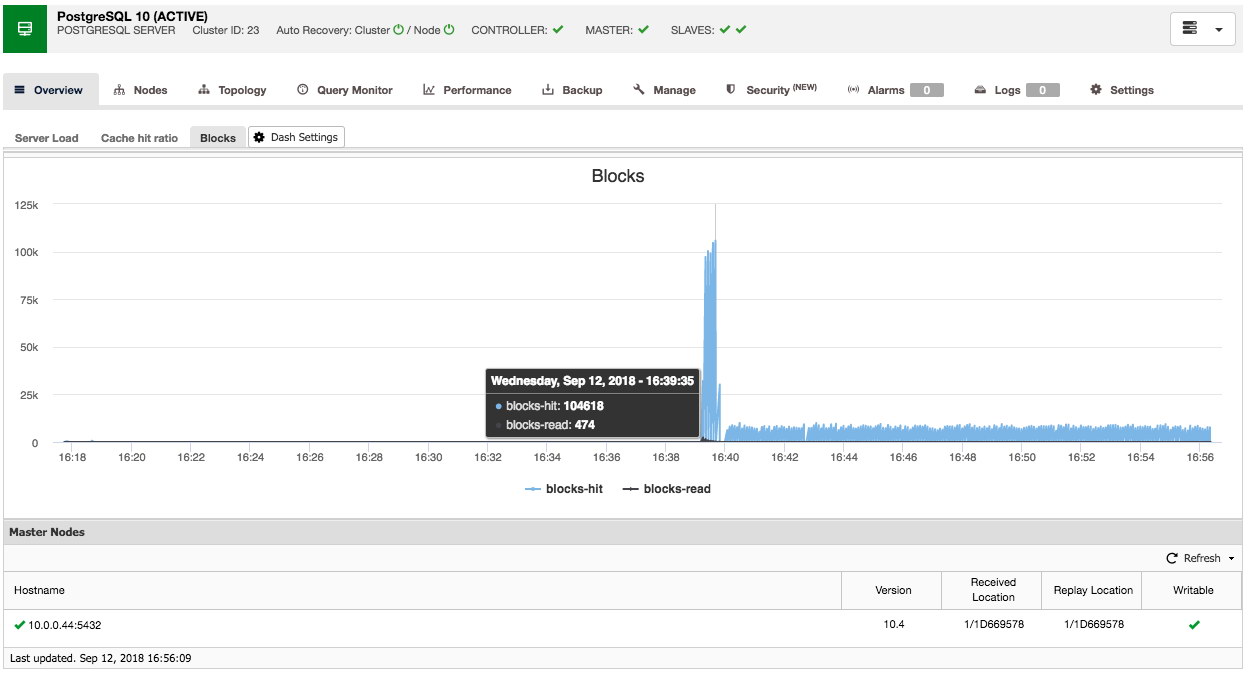
So as you can see, it is relatively easy to customize your own (default) dashboard.

Cluster Overview - Query Monitor

The Query Monitor tab is available for both MySQL and PostgreSQL based setups and consists out of three dashboards: Top Queries, Running Queries and Query Outliers.

In the Running Queries dashboard, you will find all current queries that are running. This is basically the equivalent of SHOW FULL PROCESSLIST statement in MySQL database.

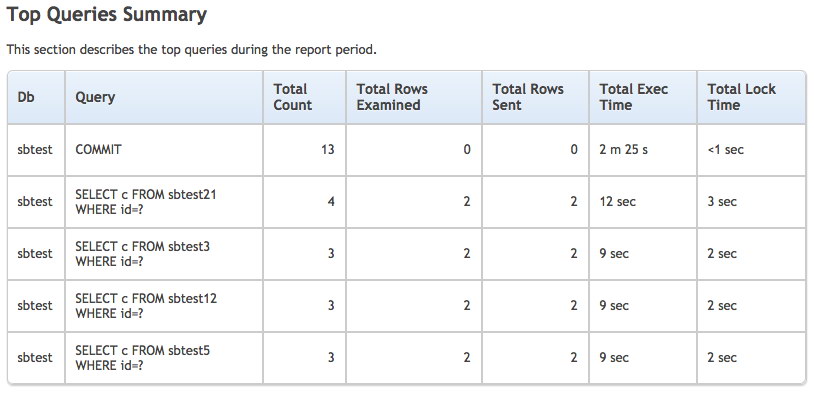
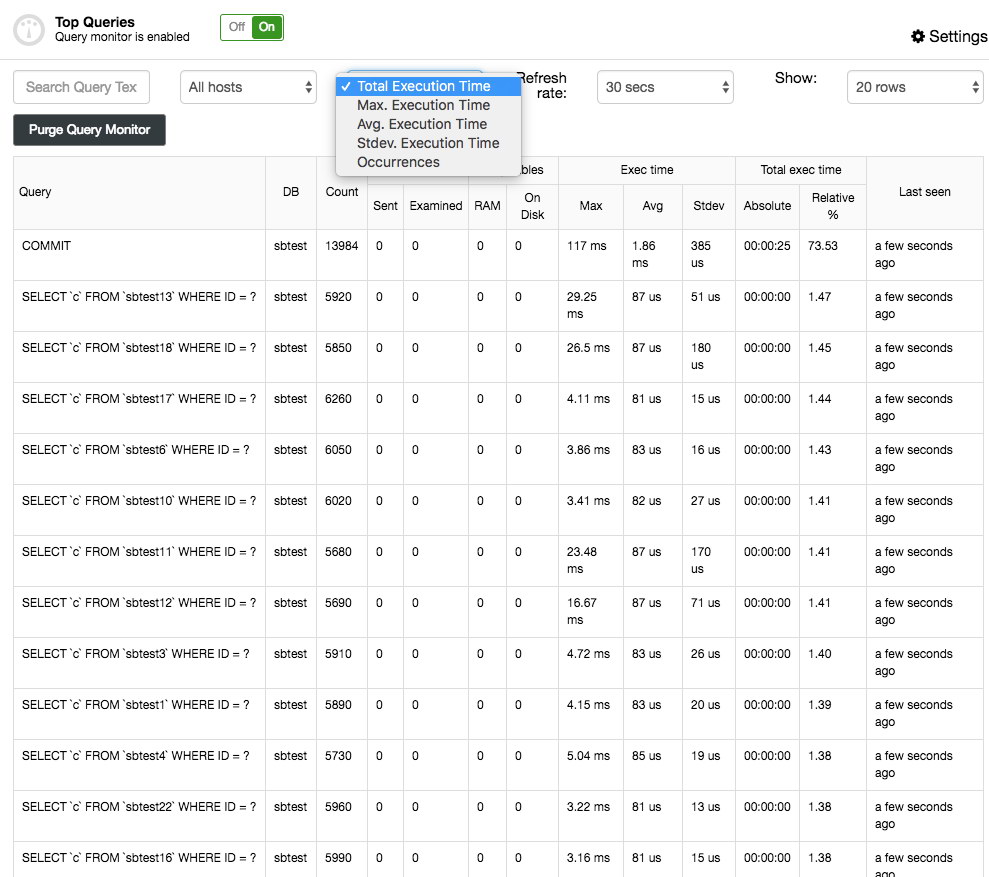
Top Queries and Query Outliers both rely on the input of the slow query log or Performance Schema. Using Performance Schema is always recommended and will be used automatically if enabled. Otherwise, ClusterControl will use the MySQL slow query log to capture the running queries. To prevent ClusterControl from being too intrusive and the slow query log to grow too large, ClusterControl will sample the slow query log by turning it on and off. This loop is by default set to 1 second capturing and the long_query_time is set to 0.5 seconds. If you wish to change these settings for your cluster, you can change this via Settings -> Query Monitor.

Top Queries will, like the name says, show the top queries that were sampled. You can sort them on various columns: for instance the frequency, average execution time, total execution time or standard deviation time:

You can get more details about the query by selecting it and this will present the query execution plan (if available) and optimization hints/advisories. The Query Outliers is similar to the Top Queries but then allows you to filter the queries per host and compare them in time.

ClusterControl
Single Console for Your Entire Database Infrastructure
Find out what else is new in ClusterControl

Cluster Overview - Operations

Similar to the PostgreSQL and MySQL systems the MongoDB clusters have the Operations overview and is similar to the MySQL's Running Queries. This overview is similar to issuing the db.currentOp() command within MongoDB.

Cluster Overview - Performance

MySQL/Galera

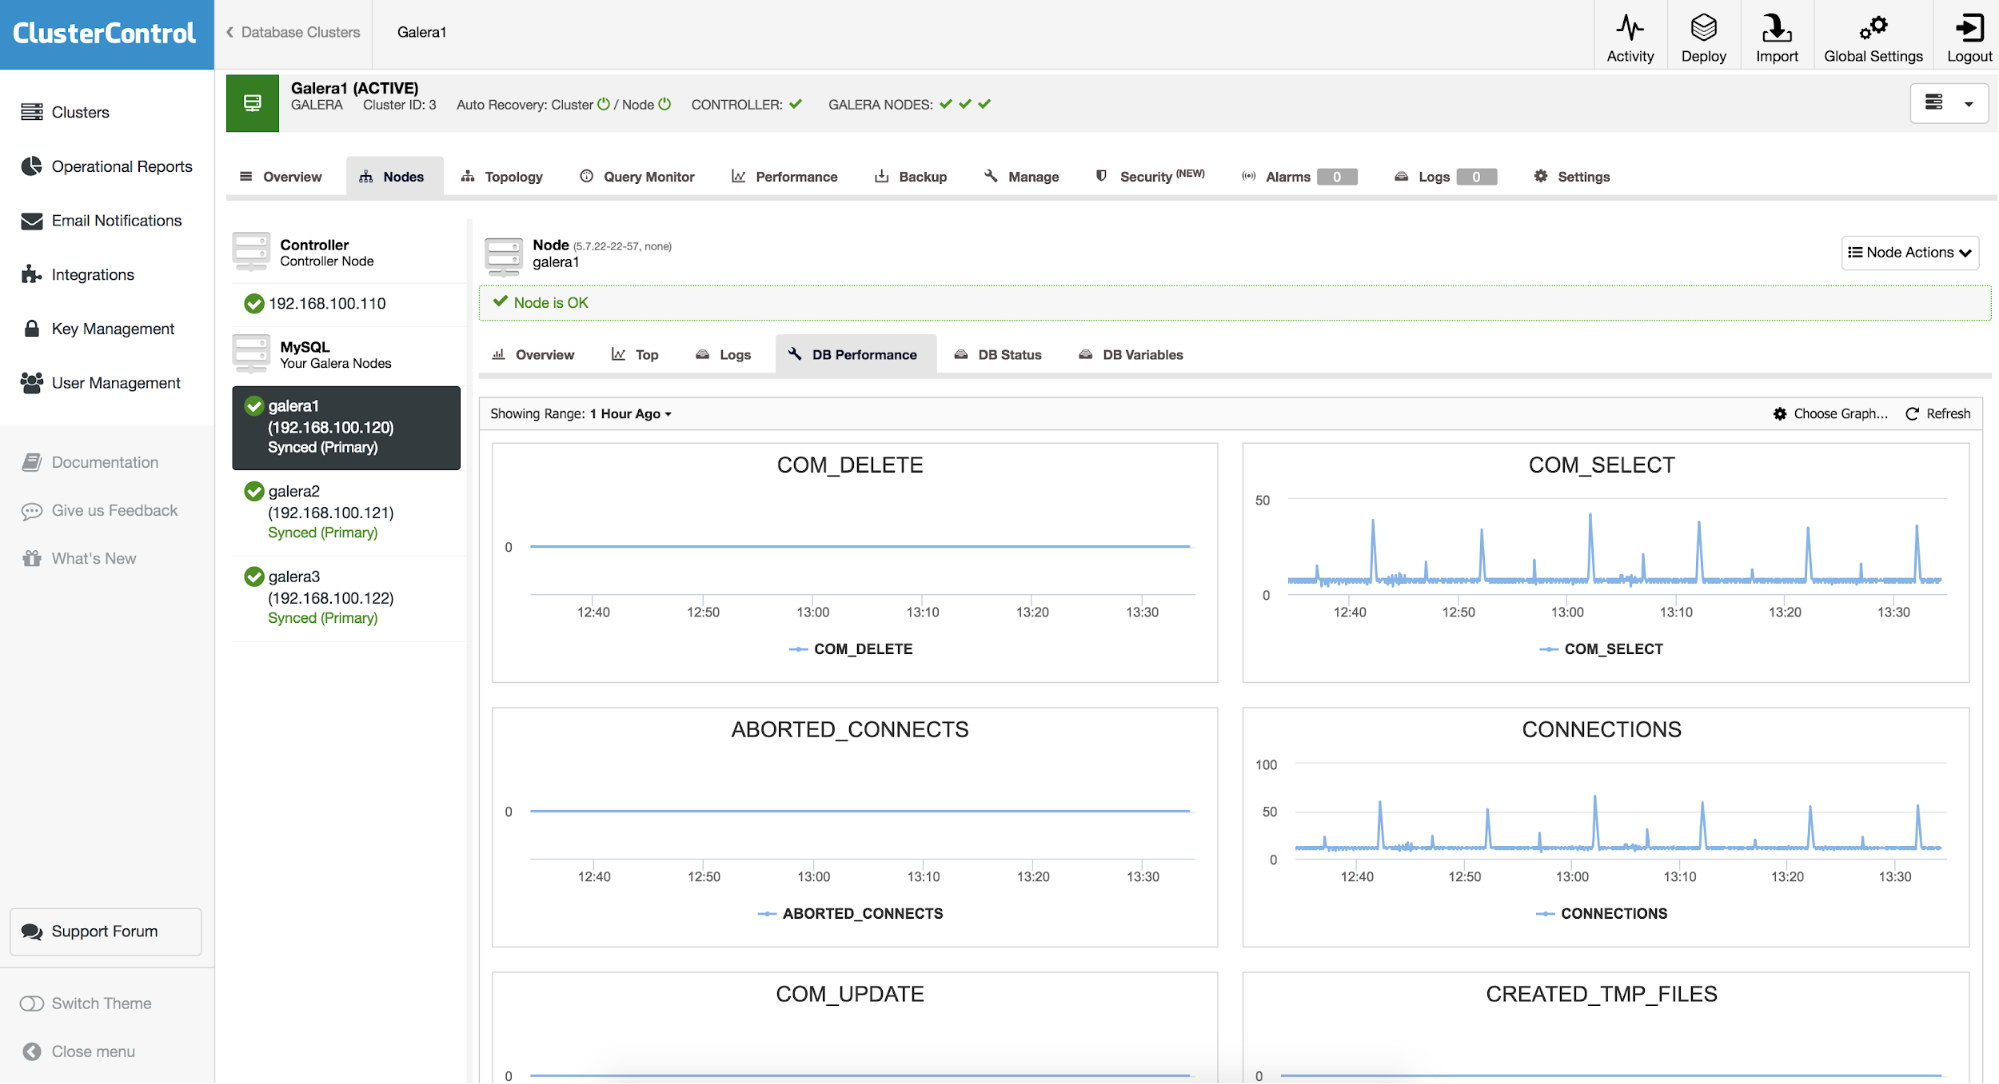
The performance tab is probably the best place to find the overall performance and health of your clusters. For MySQL and Galera it consists of an Overview page, the Advisors, status/variables overviews, the Schema Analyzer and the Transaction log.

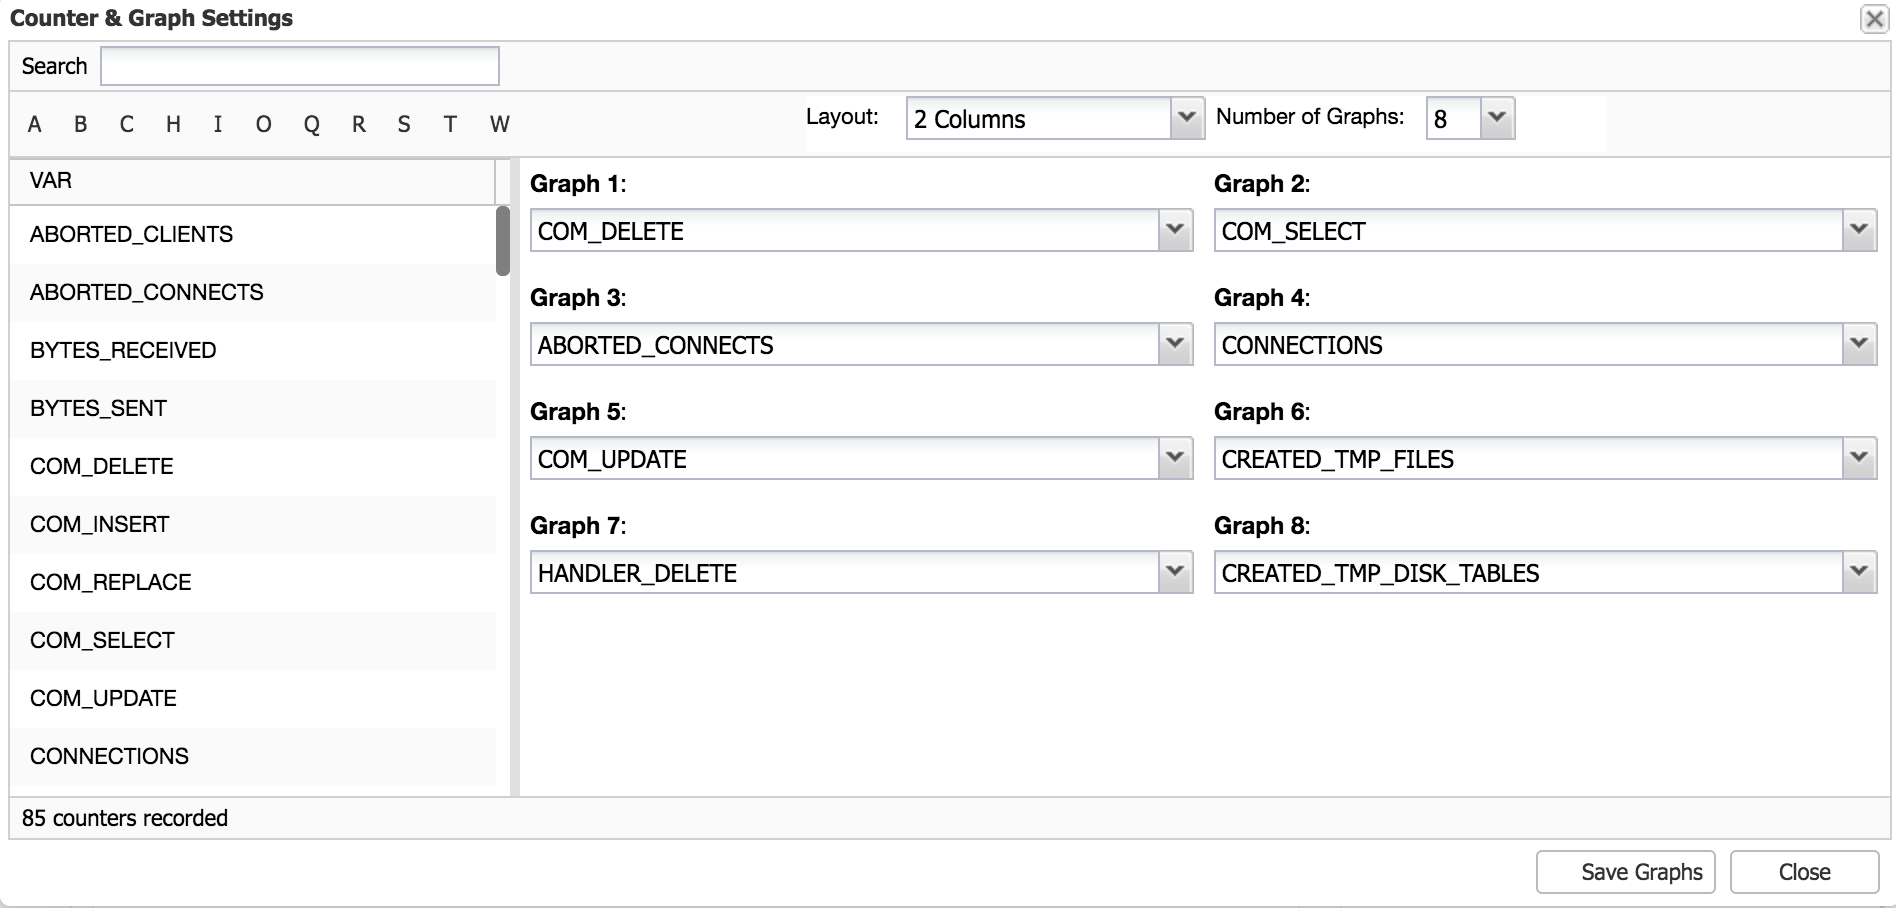
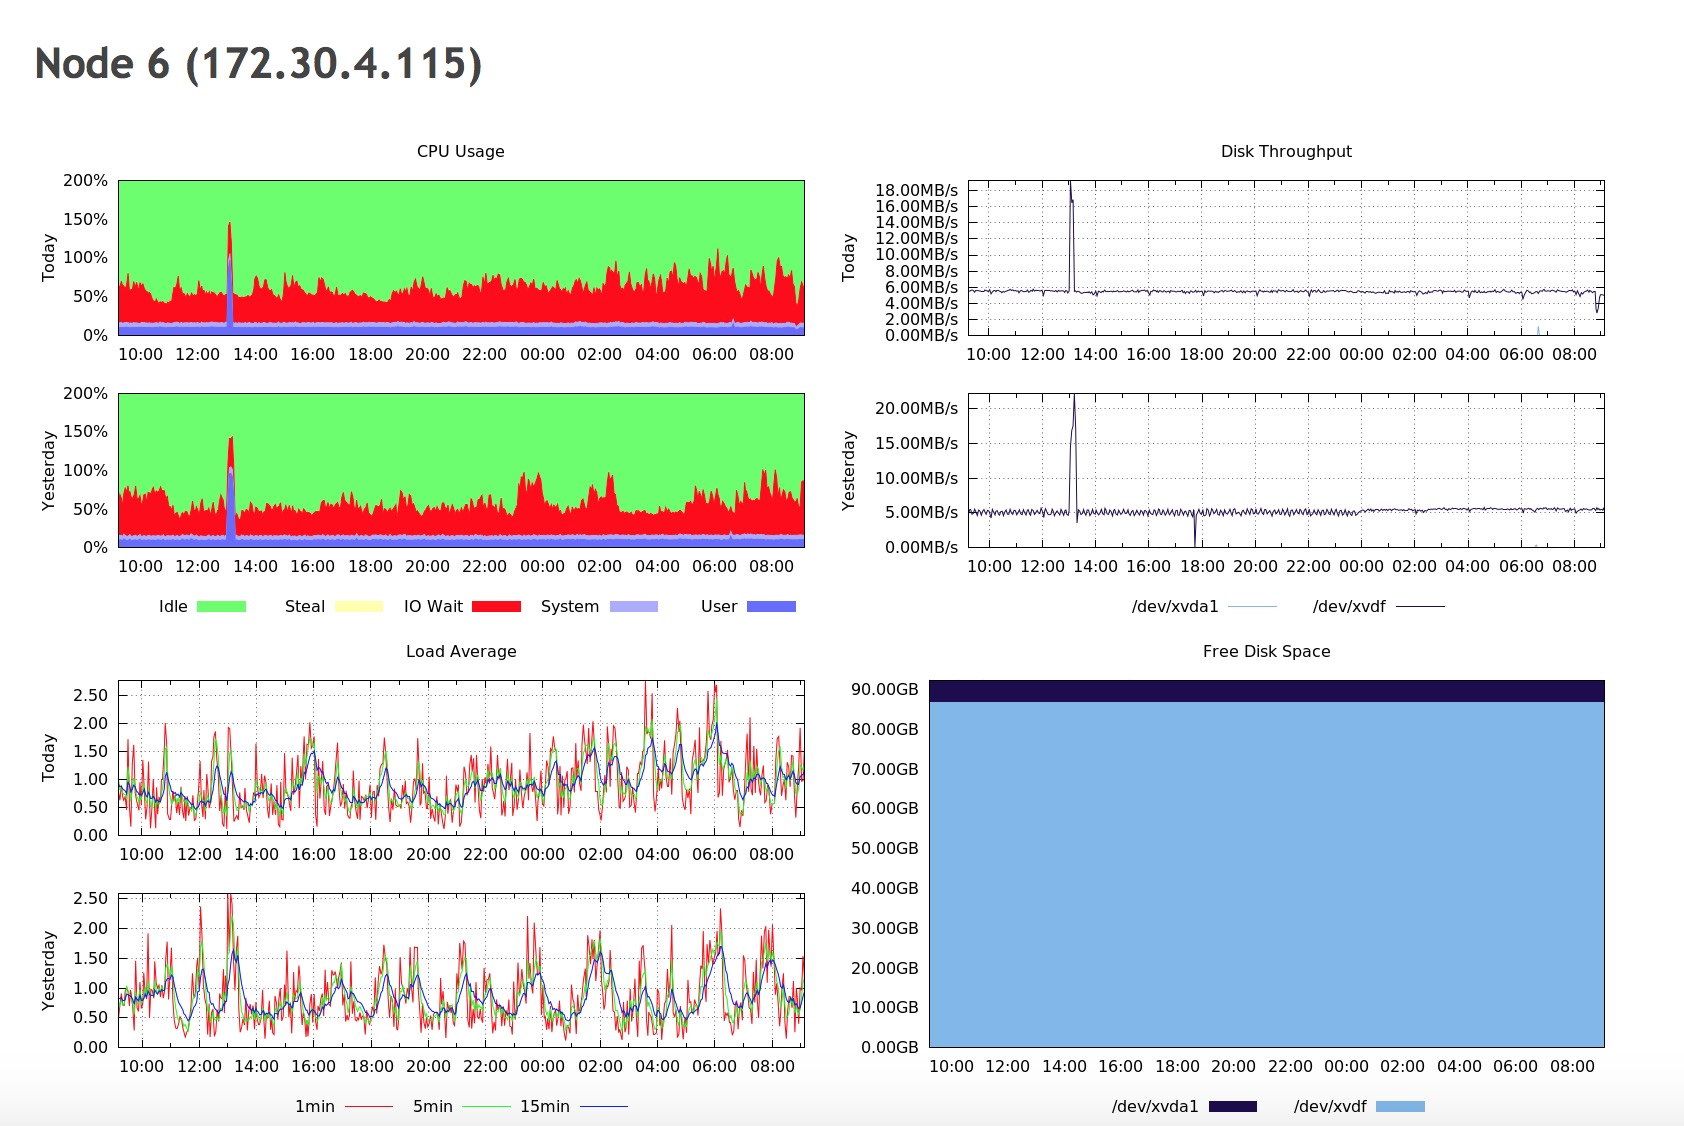
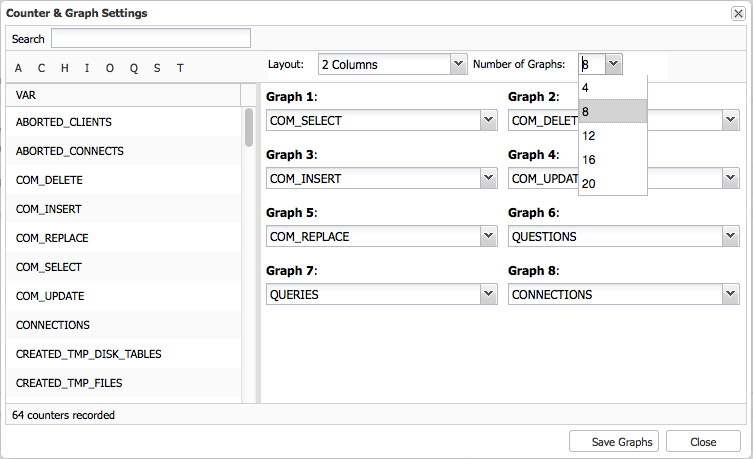
The Overview page will give you a graph overview of the most important metrics in your cluster. This is, obviously, different per cluster type. Eight metrics have been set by default, but you can easily set your own - up to 20 graphs if needed:

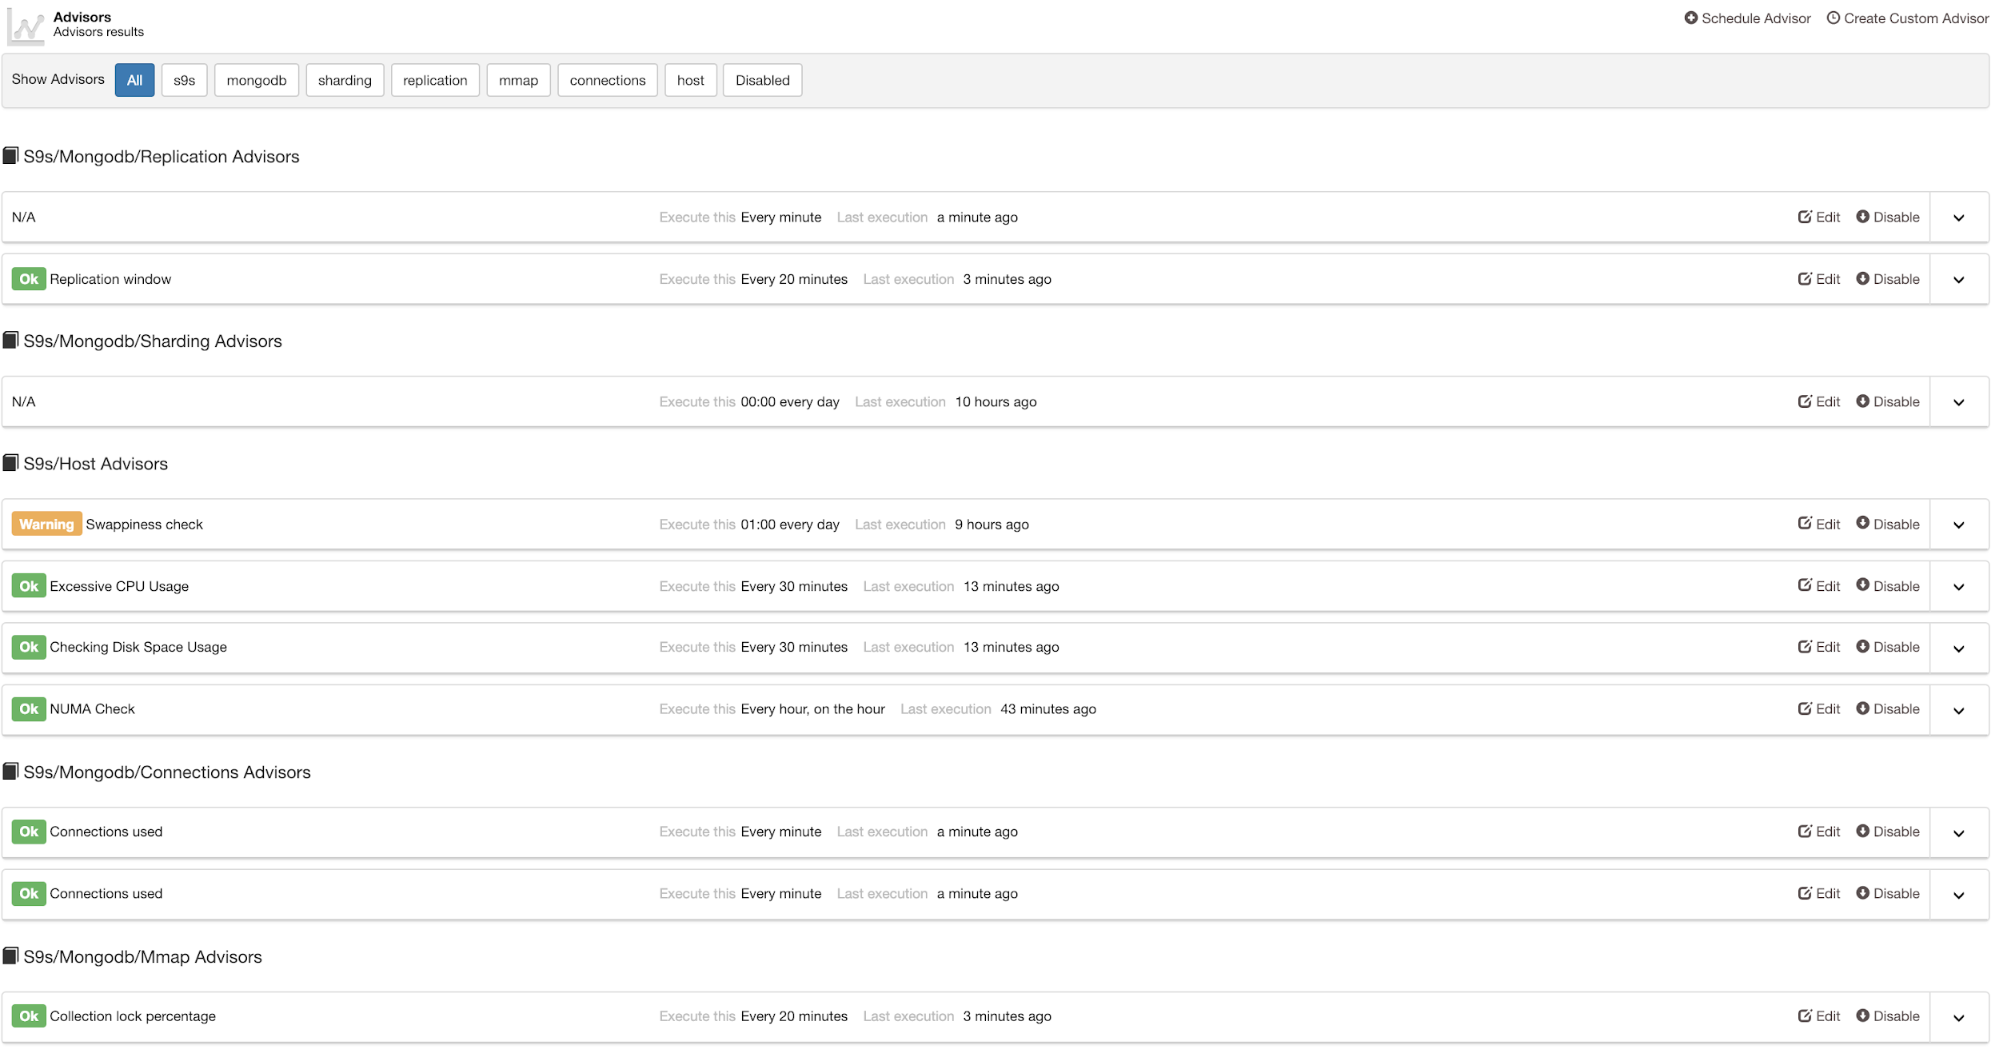
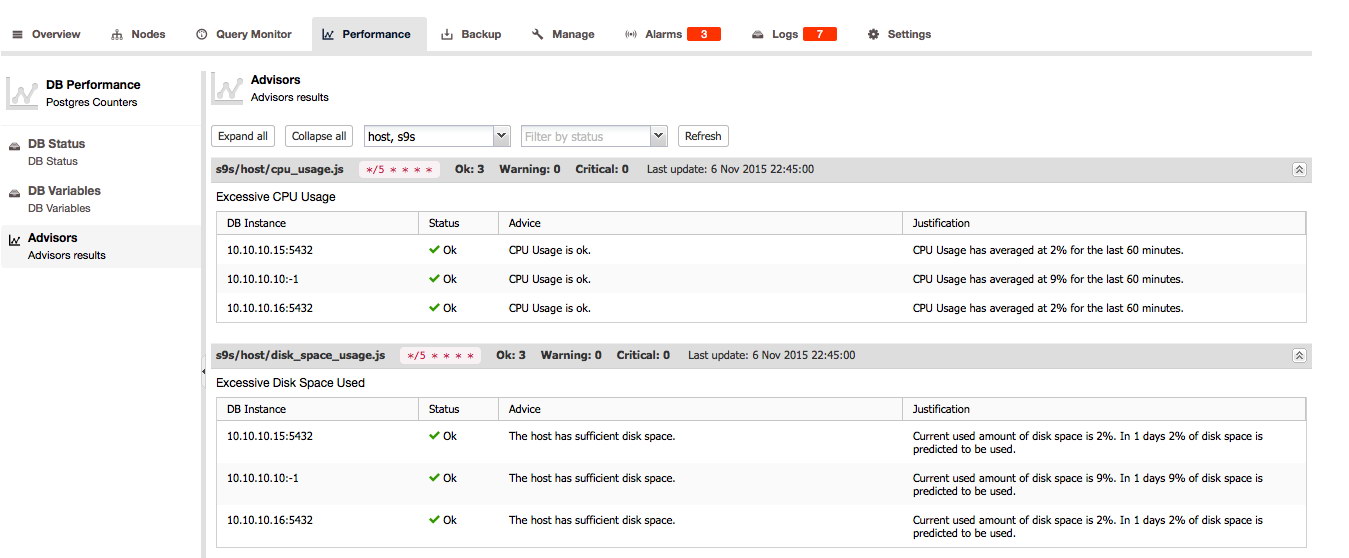
The Advisors is one of the key features of ClusterControl: the Advisors are scripted checks that can be run on demand. The advisors can evaluate almost any fact known about the host and/or cluster and give its opinion on the health of the host and/or cluster and even can give advice on how to resolve issues or improve your hosts!

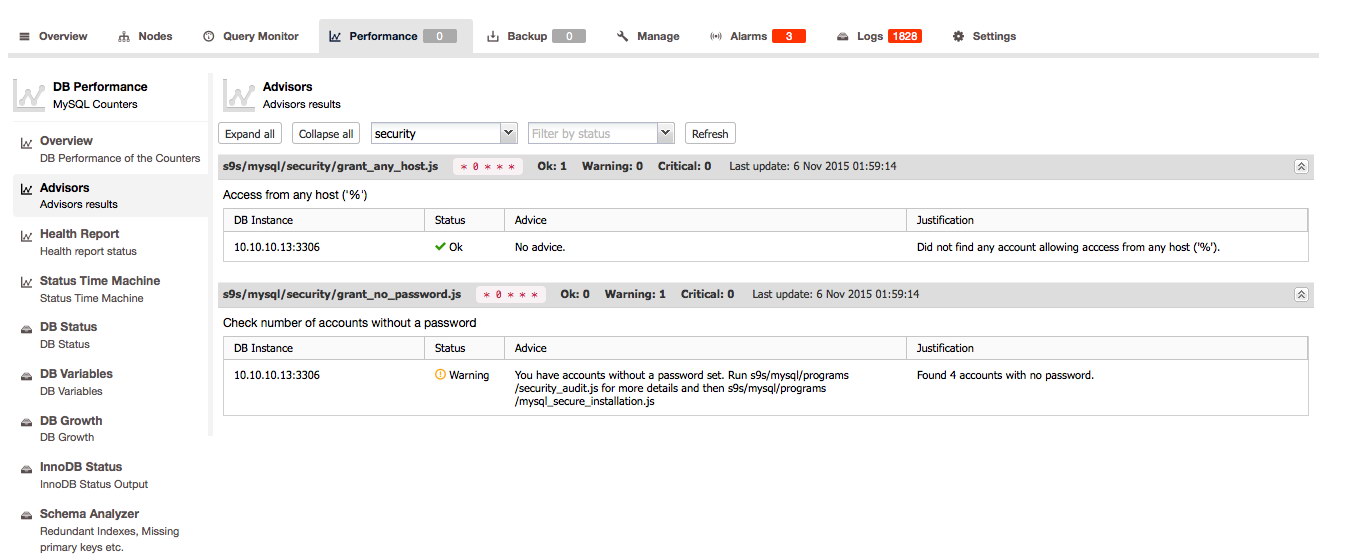
The best part is yet to come: you can create your own checks in the Developer Studio (ClusterControl -> Manage -> Developer Studio), run them on a regular interval and use them again in the Advisors section. We blogged about this new feature earlier this year.

We will skip the status/variables overview of MySQL and Galera as this is useful for reference but not for this blog post: it is good enough that you know it is here.

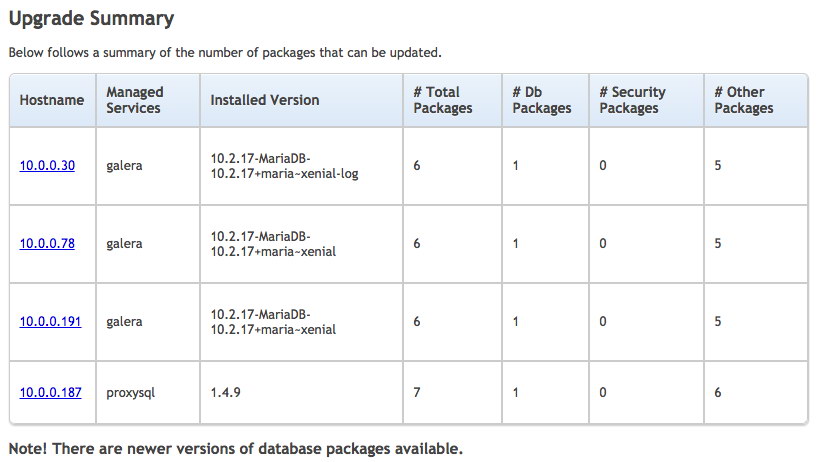
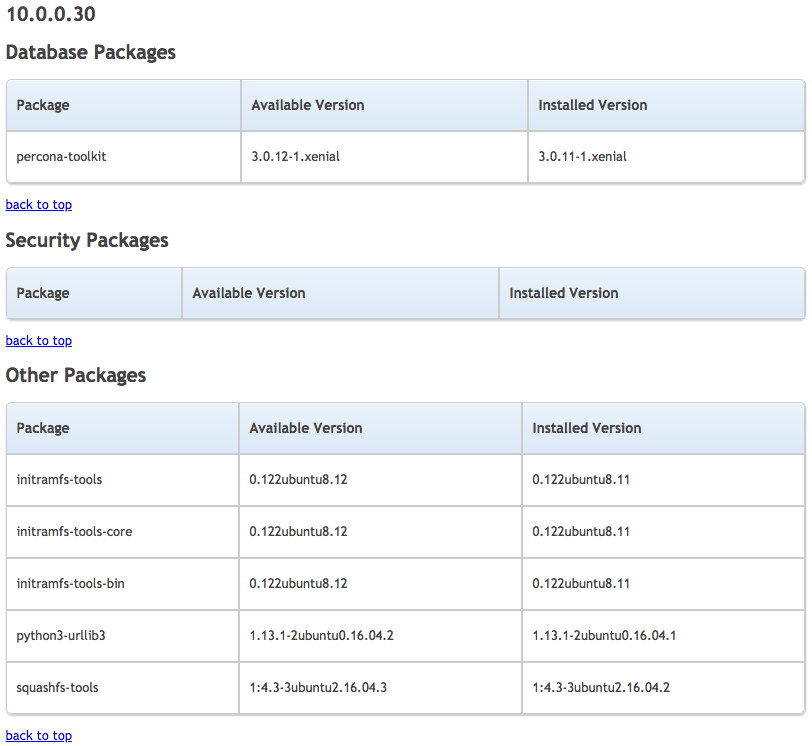
Now suppose your database is growing but you want to know how fast it grew in the past week. You can actually keep track of the growth of both data and index sizes from right within ClusterControl:

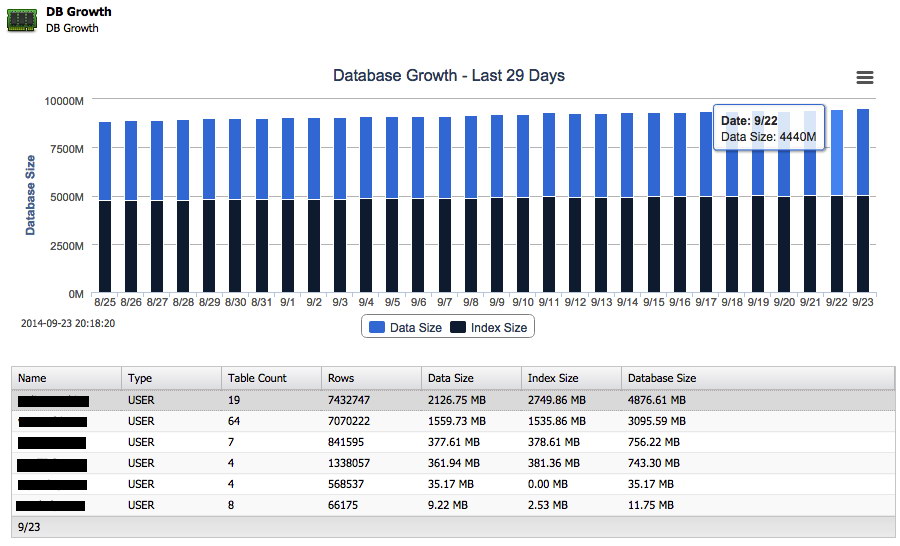
And next to the total growth on disk it can also report back the top 25 largest schemas.

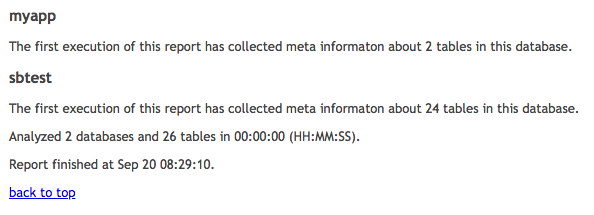
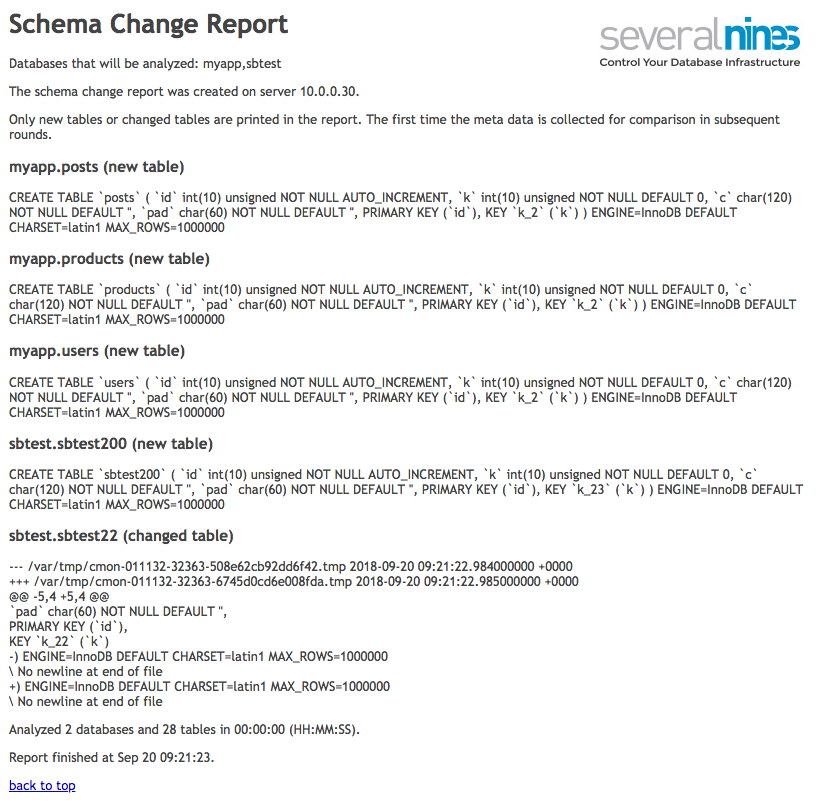
Another important feature is the Schema Analyzer within ClusterControl:

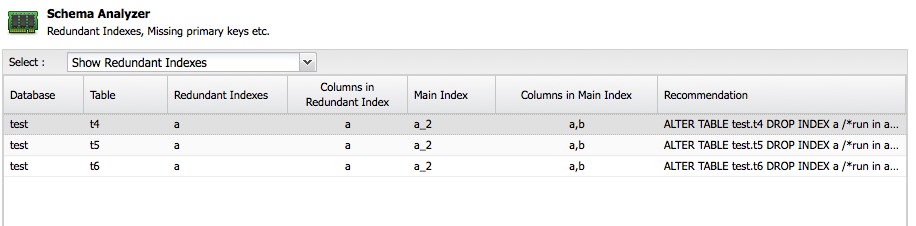
ClusterControl will analyze your schemas and look for redundant indexes, MyISAM tables and tables without a primary key. Of course it is entirely up to you to keep a table without a primary key because some application might have created it this way, but at least it is great to get the advice here for free. The Schema Analyzer even recommends the necessary ALTER statement to fix the problem.

PostgreSQL

For PostgreSQL the Advisors, DB Status and DB Variables can be found here:
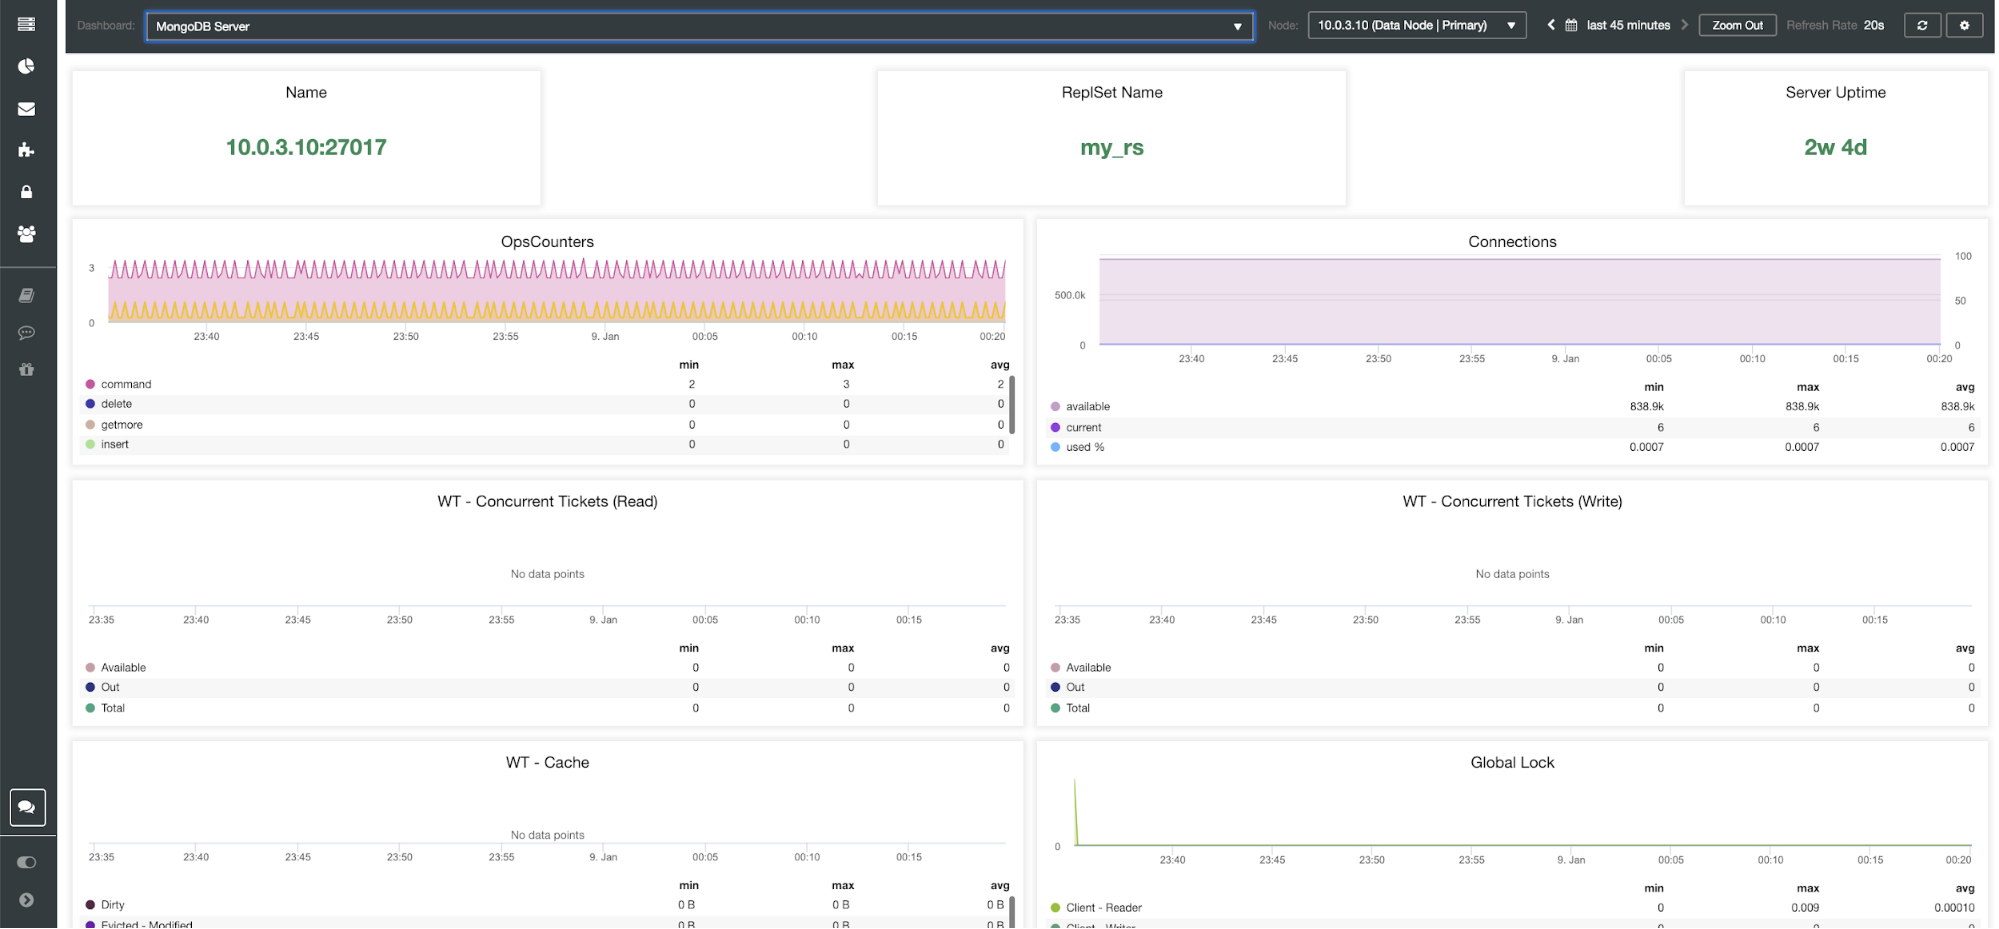
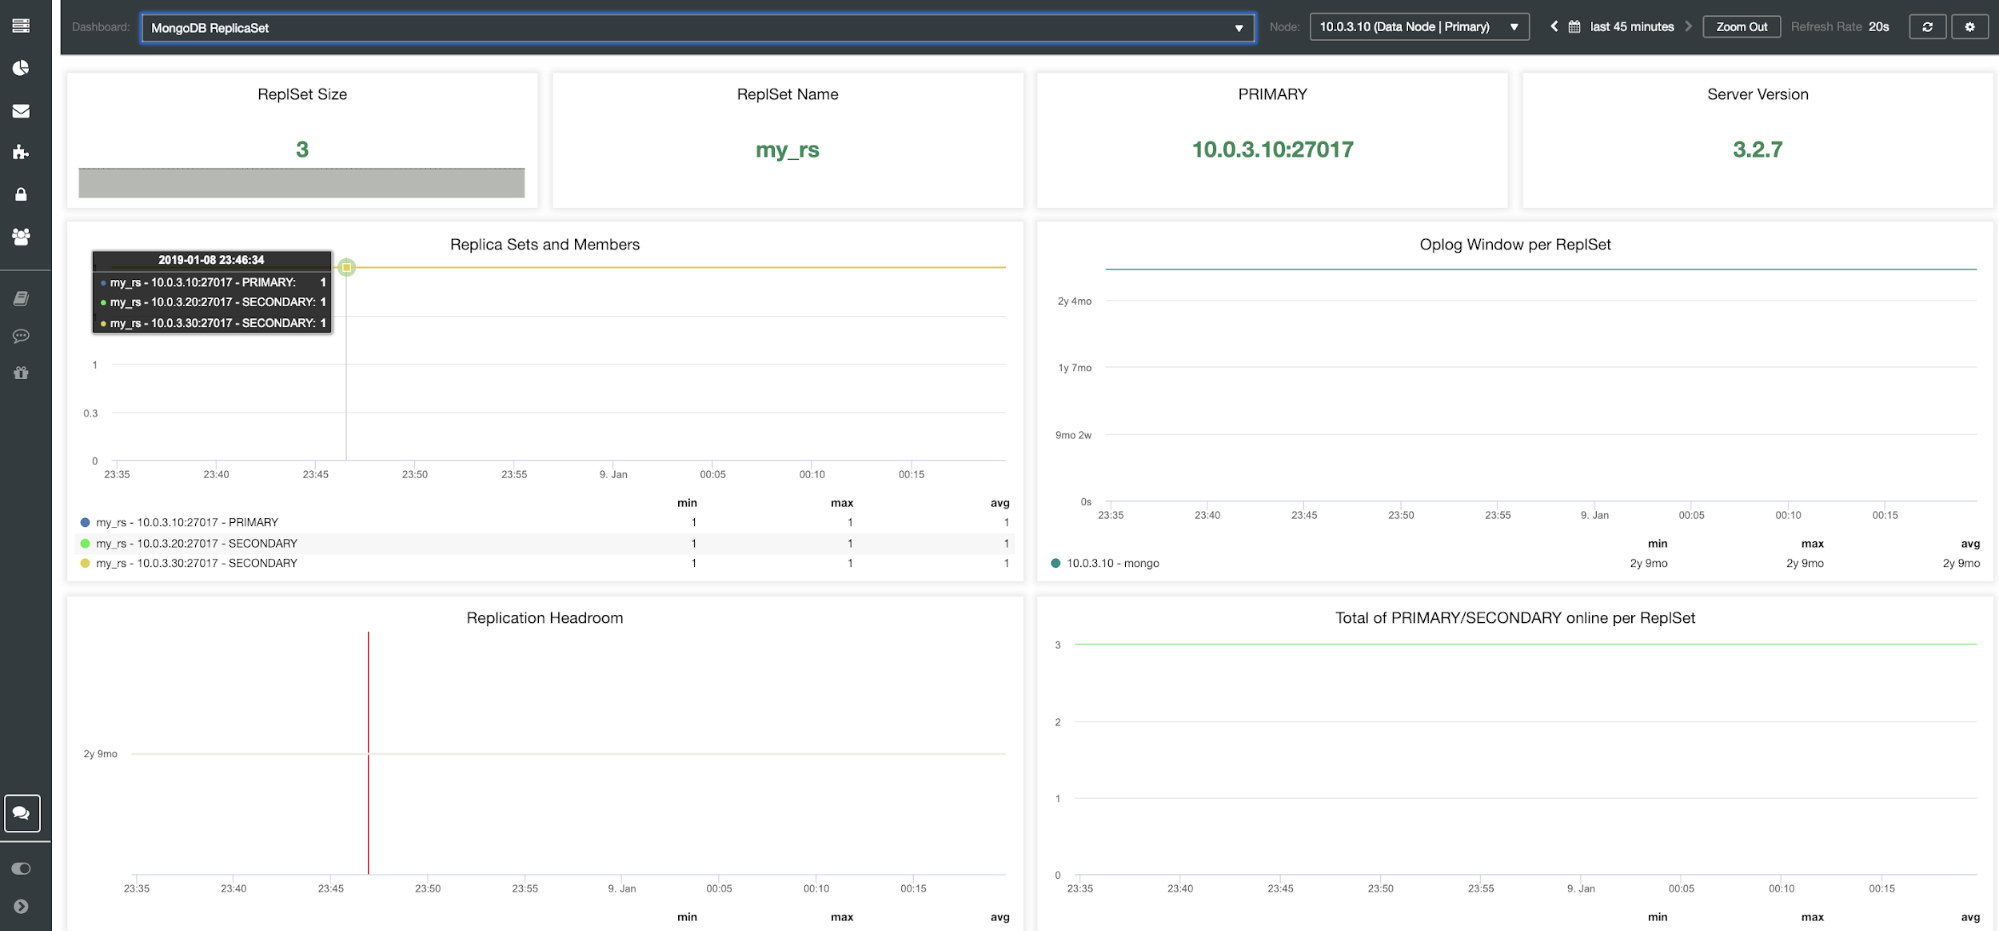
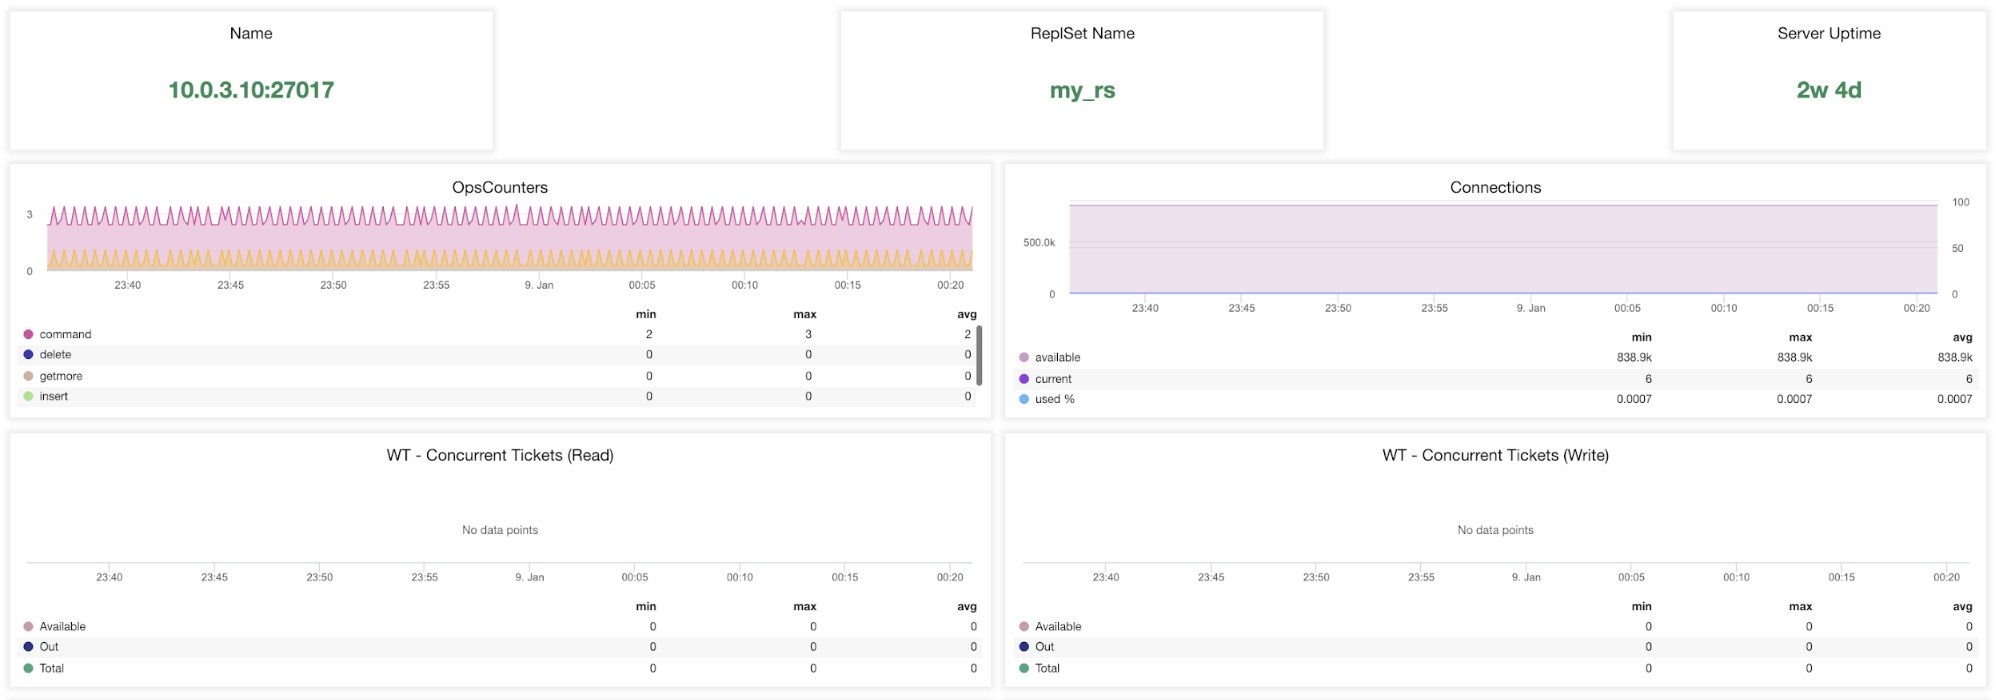
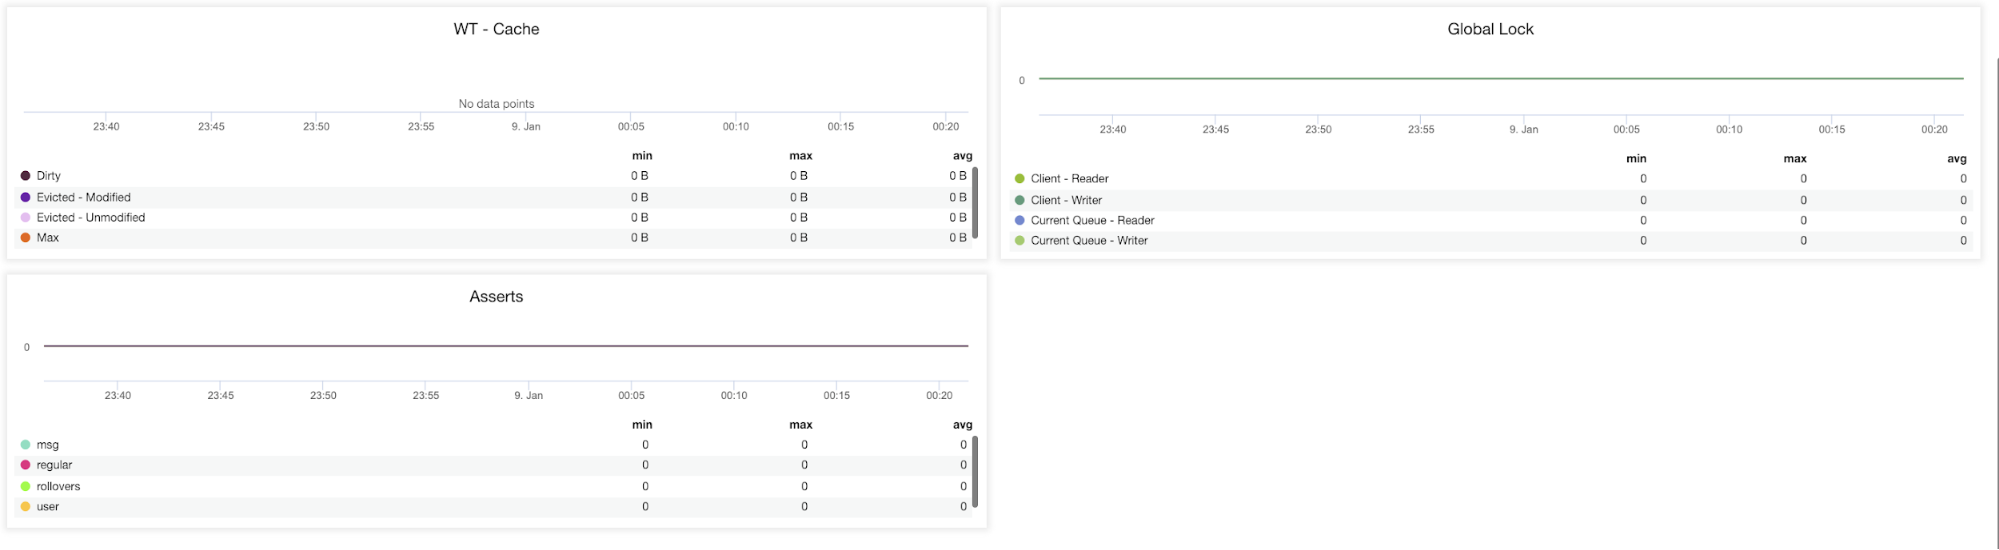
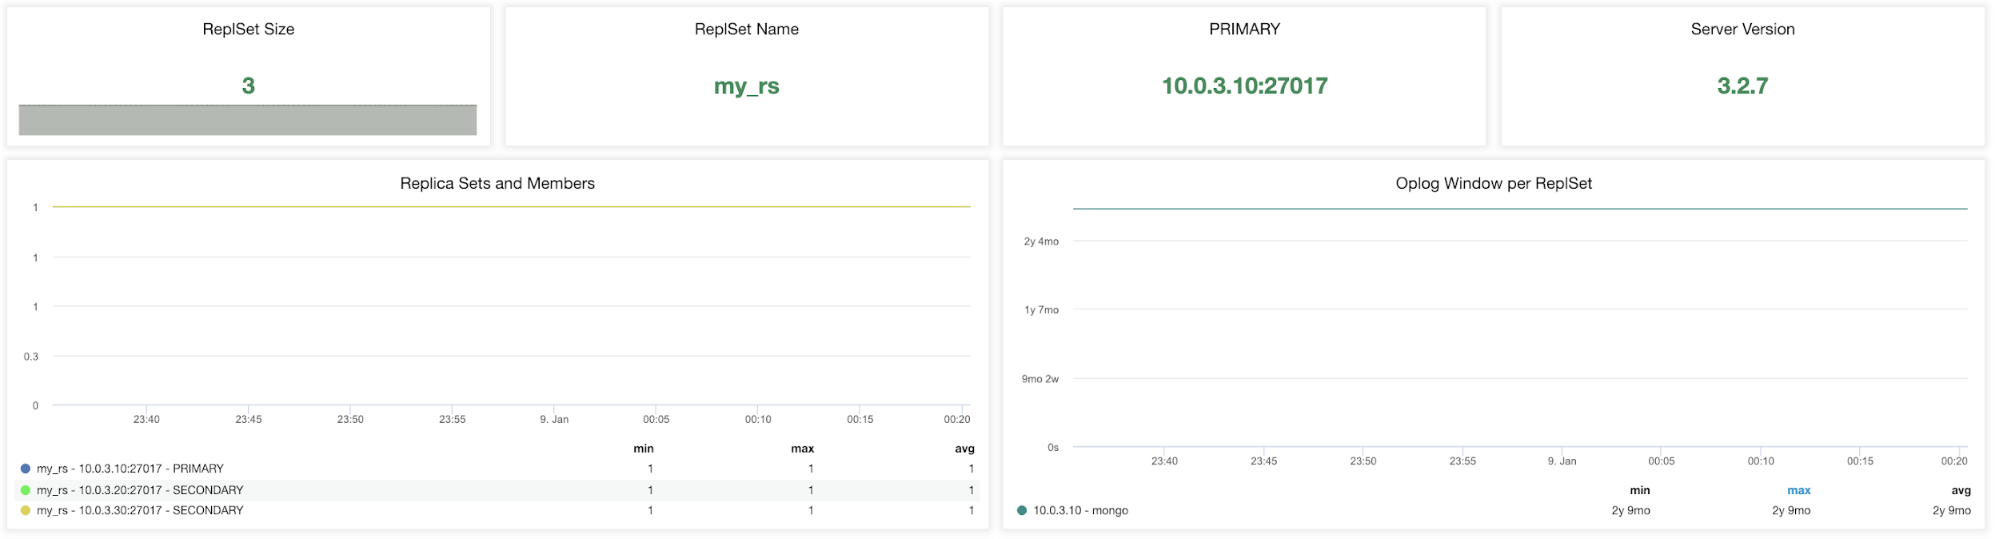
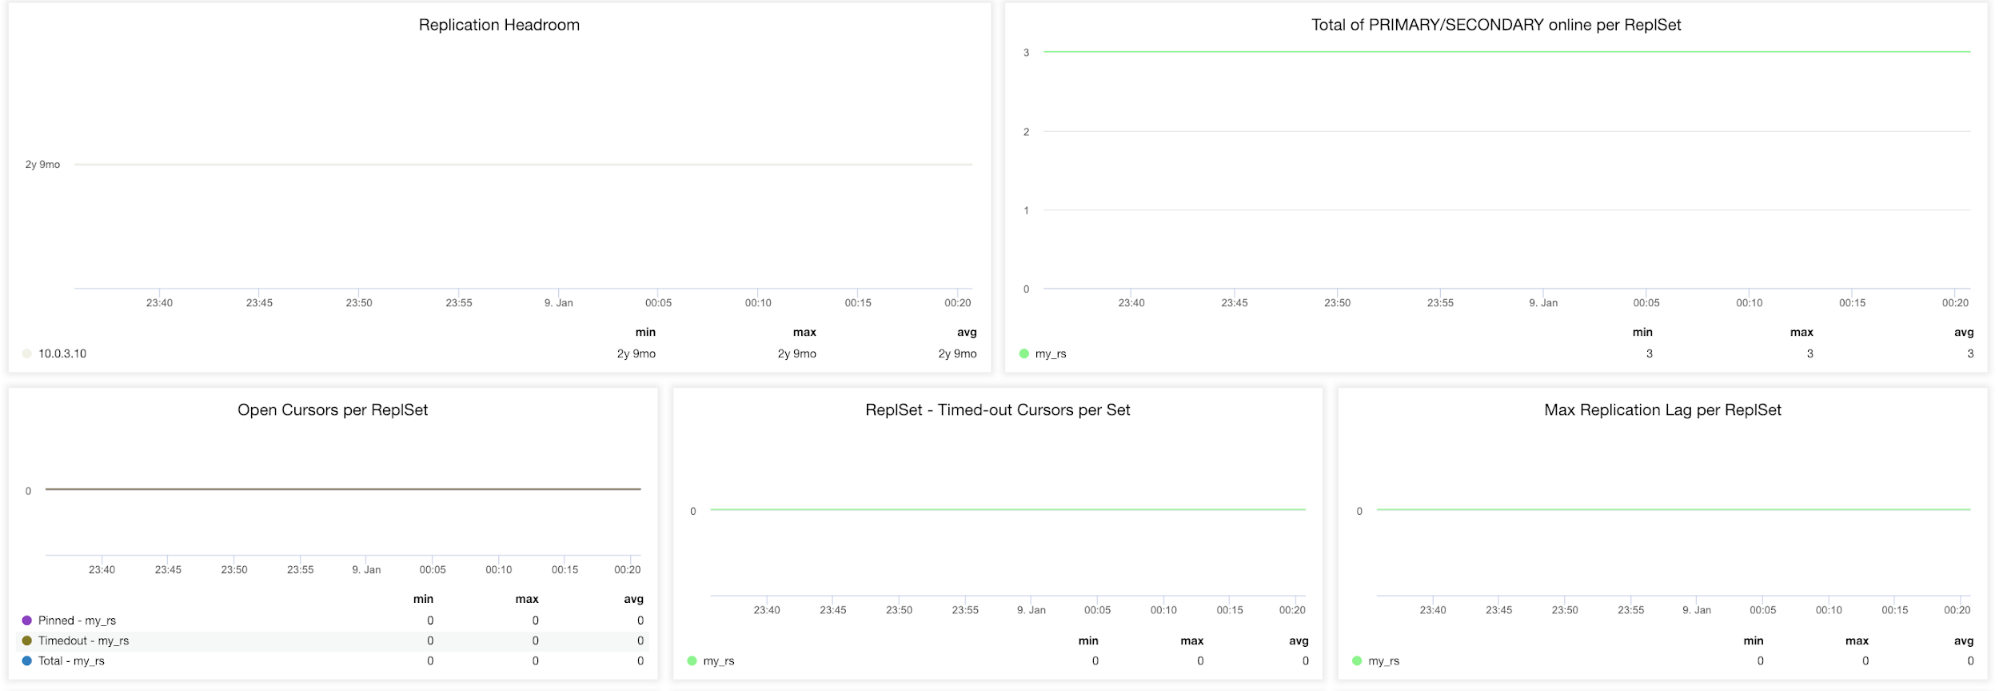
MongoDB

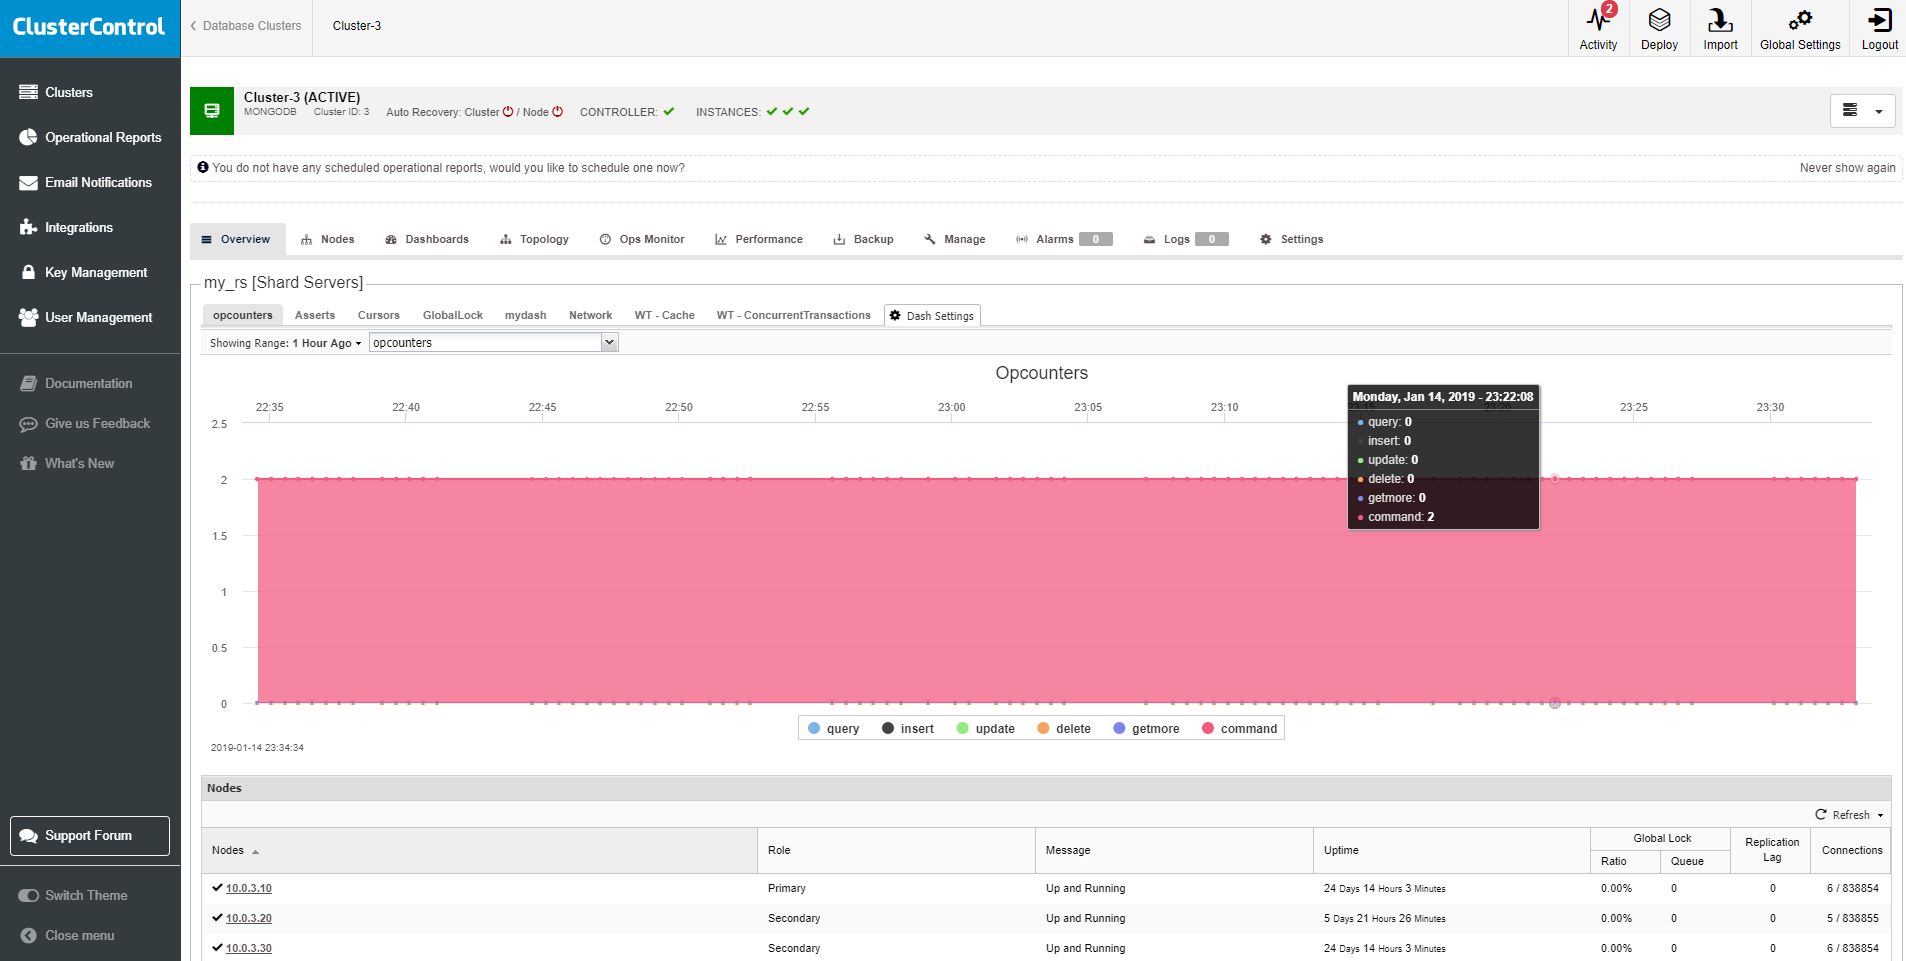
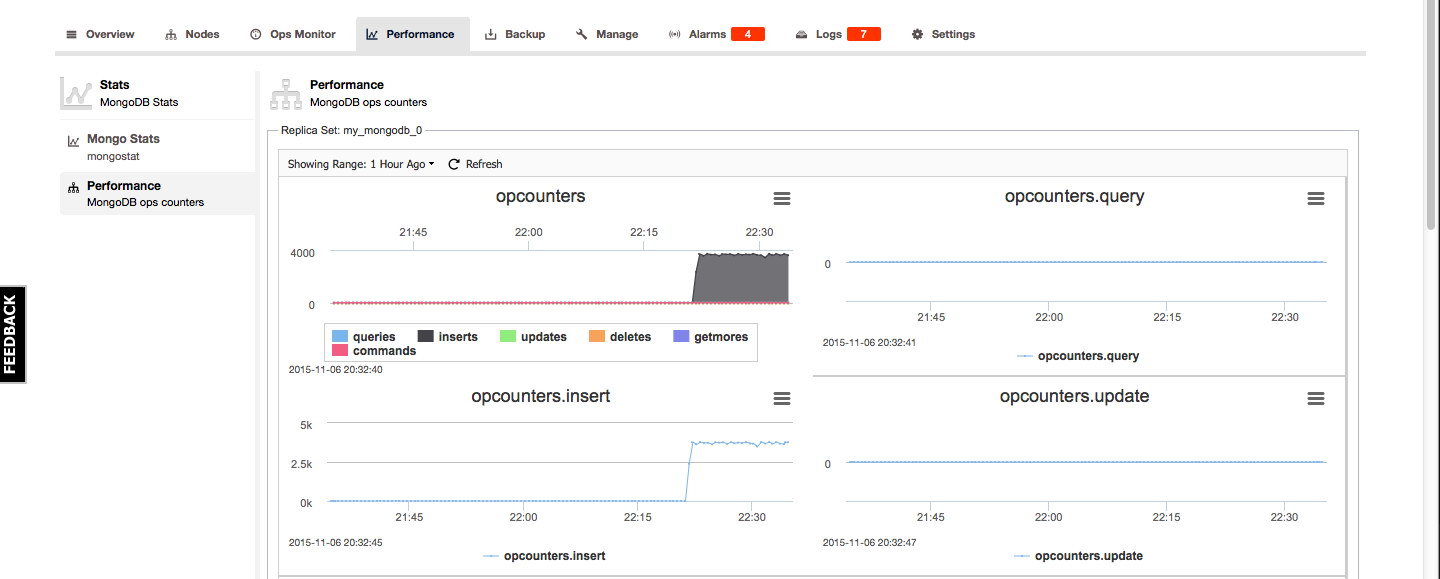
For MongoDB the Mongo Stats and performance overview can be found under the Performance tab. The Mongo Stats is an overview of the output of mongostat and the Performance overview gives a good graphical overview of the MongoDB opcounters:

Final Thoughts

We showed you how to keep your eyeballs on the most important monitoring and health checking features of ClusterControl. Obviously this is only the beginning of the journey as we will soon start another blog series about the Developer Studio capabilities and how you can make most of your own checks. Also keep in mind that our support for MongoDB and PostgreSQL is not as extensive as our MySQL toolset, but we are continuously improving on this.

You may ask yourself why we have skipped over the performance monitoring and health checks of HAProxy, ProxySQL and MaxScale. We did that deliberately as the blog series covered only deployments of clusters up till now and not the deployment of HA components. So that’s the subject we'll cover next time.


Custom Graphs to Monitor your MySQL, MariaDB, MongoDB and PostgreSQL Systems - ClusterControl Tips & Tricks

$
0
0

Graphs are important, as they are your window onto your monitored systems. ClusterControl comes with a predefined set of graphs for you to analyze, these are built on top of the metric sampling done by the controller. Those are designed to give you, at first glance, as much information as possible about the state of your database cluster. You might have your own set of metrics you’d like to monitor though. Therefore ClusterControl allows you to customize the graphs available in the cluster overview section and in the Nodes -> DB Performance tab. Multiple metrics can be overlaid on the same graph.

Cluster Overview tab

Let’s take a look at the cluster overview - it shows the most important information aggregated under different tabs.

Cluster Overview Graphs

You can see graphs like “Cluster Load” and “Galera - Flow Ctrl” along with couple of others. If this is not enough for you, you can click on “Dash Settings” and then pick “Create Board” option. From there, you can also manage existing graphs - you can edit a graph by double-clicking on it, you can also delete it from the tab list.

Dashboard Settings
Dashboard Settings

When you decide to create a new graph, you’ll be presented with an option to pick metrics that you’d like to monitor. Let’s assume we are interested in monitoring temporary objects - tables, files and tables on disk. We just need to pick all three metrics we want to follow and add them to our new graph.

New Board 1
New Board 1

Next, pick some name for our new graph and pick a scale. Most of the time you want scale to be linear but in some rare cases, like when you mix metrics containing large and small values, you may want to use logarithmic scale instead.

New Board 2
New Board 2

Finally, you can pick if your template should be presented as a default graph. If you tick this option, this is the graph you will see by default when you enter the “Overview” tab.

Once we save the new graph, you can enjoy the result:

New Board 3
New Board 3

Node Overview tab

In addition to the graphs on our cluster, we can also use this functionality on each of our nodes independently. On the cluster, if we go to the “Nodes” section and select some of them, we can see an overview of it, with metrics of the operating system:

Node Overview Graphs

As we can see, we have eight graphs with information about CPU usage, Network usage, Disk space, RAM usage, Disk utilization, Disk IOPS, Swap space and Network errors, which we can use as a starting point for troubleshooting on our nodes.

ClusterControl
Single Console for Your Entire Database Infrastructure
Find out what else is new in ClusterControl

DB Performance tab

When you take a look at the node and then follow into DB Performance tab, you’ll be presented with a default of eight different metrics. You can change them or add new ones. To do that, you need to use “Choose Graph” button:

DB Performance Graphs

You’ll be presented with a new window, that allows you to configure the layout and the metrics graphed.

DB Performance Graphs Settings

Here you can pick the layout - two or three columns of graphs and number of graphs - up to 20. Then, you may want to modify which metrics you’d want to see plotted - use drop-down dialog boxes to pick whatever metric you’d like to add. Once you are ready, save the graphs and enjoy your new metrics.

We can also use the Operational Reports feature of ClusterControl, where we will obtain the graphs and the report of our cluster and nodes in a HTML report, that can be accessed through the ClusterControl UI, or schedule it to be sent by email periodically.

These graphs help us to have a complete picture of the state and behavior of our databases.

Become a ClusterControl DBA: Operational Reports for MySQL, MariaDB, PostgreSQL & MongoDB

$
0
0

The majority of DBA’s perform health checks on their databases every now and then. Usually, it would happen on a daily or weekly basis. We previously discussed why such checks are important and what they should include.

To make sure your systems are in a good shape, you’d need to go through quite a lot of information - host statistics, MySQL statistics, workload statistics, state of backups, database packages, logs and so forth. Such data should be available in every properly monitored environment, although sometimes it is scattered across multiple locations - you may have one tool to monitor MySQL state, another tool to collect system statistics, maybe a set of scripts, e.g., to check the state of your backups. This makes health checks much more time-consuming than they should be - the DBA has to put together the different pieces to understand the state of the system.

Integrated tools like ClusterControl have an advantage that all of the bits are located in the same place (or in the same application). It still does not mean they are located next to each other - they may be located in different sections of the UI and a DBA may have to spend some time clicking through the UI to reach all the interesting data.

The whole idea behind creating Operational Reports is to put all of the most important data into a single document, which can be quickly reviewed to get an understanding of the state of the databases.

Operational Reports are available from the menu Side Menu -> Operational Reports:

Once you go there, you’ll be presented with a list of reports created manually or automatically, based on a predefined schedule:

If you want to create a new report manually, you’ll use the 'Create' option. Pick the type of report, cluster name (for per-cluster report), email recipients (optional - if you want the report to be delivered to you), and you’re pretty much done:

The reports can also be scheduled to be created on a regular basis:

At this time, 5 types of reports are available:

  • Availability report - All clusters.
  • Backup report - All clusters.
  • Schema change report - MySQL/MariaDB-based cluster only.
  • Daily system report - Per cluster.
  • Package upgrade report - Per cluster.

Availability Report

Availability reports focuses on, well, availability. It includes three sections. First, availability summary:

You can see information about availability statistics of your databases, the cluster type, total uptime and downtime, current state of the cluster and when that state last changed.

Another section gives more details on availability for every cluster. The screenshot below only shows one of the database cluster:

We can see when a node switched state and what the transition was. It’s a nice place to check if there were any recent problems with the cluster. Similar data is shown in the third section of this report, where you can go through the history of changes in cluster state.

Backup Report

The second type of the report is one covering backups of all clusters. It contains two sections - backup summary and backup details, where the former basically gives you a short summary of when the last backup was created, if it completed successfully or failed, backup verification status, success rate and retention period:

ClusterControl also provides examples of backup policy if it finds any of the monitored database cluster running without any scheduled backup or delayed slave configured. Next are the backup details:

You can also check the list of backups executed on the cluster with their state, type and size within the specified interval. This is as close you can get to be certain that backups work correctly without running a full recovery test. We definitely recommend that such tests are performed every now and then. Good news is ClusterControl supports MySQL-based restoration and verification on a standalone host under Backup -> Restore Backup.

Daily System Report

This type of report contains detailed information about a particular cluster. It starts with a summary of different alerts which are related to the cluster:

Next section is about the state of the nodes that are part of the cluster:

You have a list of the nodes in the cluster, their type, role (master or slave), status of the node, uptime and the OS.

Another section of the report is the backup summary, same as we discussed above. Next one presents a summary of top queries in the cluster:

Finally, we see a “Node status overview” in which you’ll be presented with graphs related to OS and MySQL metrics for each node.

As you can see, we have here graphs covering all of the aspects of the load on the host - CPU, memory, network, disk, CPU load and disk free. This is enough to get an idea whether anything weird happened recently or not. You can also see some details about MySQL workload - how many queries were executed, which type of query, how the data was accessed (via which handler)? This, on the other hand, should be enough to pick most of the issues on MySQL side. What you want to look at are all spikes and dips that you haven’t seen in the past. Maybe a new query has been added to the mix and, as a result, handler_read_rnd_next skyrocketed? Maybe there was an increase of CPU load and a high number of connections might point to increased load on MySQL, but also to some kind of contention. An unexpected pattern might be good to investigate, so you know what is going on.

Package Upgrade Report

This report gives a summary of packages available for upgrade by the repository manager on the monitored hosts. For an accurate reporting, ensure you always use stable and trusted repositories on every host. In some undesirable occasions, the monitored hosts could be configured with an outdated repository after an upgrade (e.g, every MariaDB major version uses different repository), incomplete internal repository (e.g, partial mirrored from the upstream) or bleeding edge repository (commonly for unstable nightly-build packages).

The first section is the upgrade summary:

It summarizes the total number of packages available for upgrade as well as the related managed service for the cluster like load balancer, virtual IP address and arbitrator. Next, ClusterControl provides a detailed package list, grouped by package type for every host:

This report provides the available version and can greatly help us plan our maintenance window efficiently. For critical upgrades like security and database packages, we could prioritize it over non-critical upgrades, which could be consolidated with other less priority maintenance windows.

Schema Change Report

This report compares the selected MySQL/MariaDB database changes in table structure which happened between two different generated reports. In the MySQL/MariaDB older versions, DDL operation is a non-atomic operation (pre 8.0) and requires full table copy (pre 5.6 for most operations) - blocking other transactions until it completes. Schema changes could become a huge pain once your tables get a significant amount of data and must be carefully planned especially in a clustered setup. In a multi-tiered development environment, we have seen many cases where developers silently modify the table structure, resulting in significant impact to query performance.

In order for ClusterControl to produce an accurate report, special options must be configured inside CMON configuration file for the respective cluster:

  • schema_change_detection_address - Checks will be executed using SHOW TABLES/SHOW CREATE TABLE to determine if the schema has changed. The checks are executed on the address specified and is of the format HOSTNAME:PORT. The schema_change_detection_databases must also be set. A differential of a changed table is created (using diff).
  • schema_change_detection_databases - Comma separated list of databases to monitor for schema changes. If empty, no checks are made.

In this example, we would like to monitor schema changes for database "myapp" and "sbtest" on our MariaDB Cluster with cluster ID 27. Pick one of the database nodes as the value of schema_change_detection_address. For MySQL replication, this should be the master host, or any slave host that holds the databases (in case partial replication is active). Then, inside /etc/cmon.d/cmon_27.cnf, add the two following lines:

schema_change_detection_address=10.0.0.30:3306
schema_change_detection_databases=myapp,sbtest

Restart CMON service to load the change:

$ systemctl restart cmon

For the first and foremost report, ClusterControl only returns the result of metadata collection, similar to below:

With the first report as the baseline, the subsequent reports will return the output that we are expecting for:

Take note only new tables or changed tables are printed in the report. The first report is only for metadata collection for comparison in the subsequent rounds, thus we have to run it for at least twice to see the difference.

With this report, you can now gather the database structure footprints and understand how your database has evolved across time.

Final Thoughts

Operational report is a comprehensive way to understand the state of your database infrastructure. It is built for both operational or managerial staff, and can be very useful in analysing your database operations. The reports can be generated in-place or can be delivered to you via email, which make things conveniently easy if you have a reporting silo.

We’d love to hear your feedback on anything else you’d like to have included in the report, what’s missing and what is not needed.

Introducing Agent-Based Database Monitoring with ClusterControl 1.7

$
0
0

We are excited to announce the 1.7 release of ClusterControl - the only management system you’ll ever need to take control of your open source database infrastructure!

ClusterControl 1.7 introduces new exciting agent-based monitoring features for MySQL, Galera Cluster, PostgreSQL & ProxySQL, security and cloud scaling features ... and more!

Release Highlights

Monitoring & Alerting

  • Agent-based monitoring with Prometheus
  • New performance dashboards for MySQL, Galera Cluster, PostgreSQL & ProxySQL

Security & Compliance

  • Enable/disable Audit Logging on your MariaDB databases
  • Enable policy-based monitoring and logging of connection and query activity

Deployment & Scaling

  • Automatically launch cloud instances and add nodes to your cloud deployments

Additional Highlights

  • Support for MariaDB v10.3

View the ClusterControl ChangeLog for all the details!

ClusterControl
Single Console for Your Entire Database Infrastructure
Find out what else is new in ClusterControl

View Release Details and Resources

Release Details

Monitoring & Alerting

Agent-based monitoring with Prometheus

ClusterControl was originally designed to address modern, highly distributed database setups based on replication or clustering. It provides a systems view of all the components of a distributed cluster, including load balancers, and maintains a logical topology view of the cluster.

So far we’d gone the agentless monitoring route with ClusterControl, and although we love the simplicity of not having to install or manage agents on the monitored database hosts, an agent-based approach can provide higher resolution of monitoring data and has certain advantages in terms of security.

With that in mind, we’re happy to introduce agent-based monitoring as a new feature added in ClusterControl 1.7!

It makes use of Prometheus, a full monitoring and trending system that includes built-in and active scraping and storing of metrics based on time series data. One Prometheus server can be used to monitor multiple clusters. ClusterControl takes care of installing and maintaining Prometheus as well as exporters on the monitored hosts.

Users can now enable their database clusters to use Prometheus exporters to collect metrics on their nodes and hosts, thus avoiding excessive SSH activity for monitoring and metrics collections and use SSH connectivity only for management operations.

Monitoring & Alerting

New performance dashboards for MySQL, Galera Cluster, PostgreSQL & ProxySQL

ClusterControl users now have access to a set of new dashboards that have Prometheus as the data source with its flexible query language and multi-dimensional data model, where time series data is identified by metric name and key/value pairs. This allows for greater accuracy and customization options while monitoring your database clusters.

The new dashboards include:

  • Cross Server Graphs
  • System Overview
  • MySQL Overview, Replication, Performance Schema & InnoDB Metrics
  • Galera Cluster Overview & Graphs
  • PostgreSQL Overview
  • ProxySQL Overview

Security & Compliance

Audit Log for MariaDB

Continuous auditing is an imperative task for monitoring your database environment. By auditing your database, you can achieve accountability for actions taken or content accessed. Moreover, the audit may include some critical system components, such as the ones associated with financial data to support a precise set of regulations like SOX, or the EU GDPR regulation. Usually, it is achieved by logging information about DB operations on the database to an external log file.

With ClusterControl 1.7 users can now enable a plugin that will log all of their MariaDB database connections or queries to a file for further review; it also introduces support for version 10.3 of MariaDB.

Additional New Functionalities

View the ClusterControl ChangeLog for all the details!

Download ClusterControl today!

Happy Clustering!

New White Paper on State-of-the-Art Database Management: ClusterControl - The Guide

$
0
0

Today we’re happy to announce the availability of our first white paper on ClusterControl, the only management system you’ll ever need to automate and manage your open source database infrastructure!

Download ClusterControl - The Guide!

Most organizations have databases to manage, and experience the headaches that come with that: managing performance, monitoring uptime, automatically recovering from failures, scaling, backups, security and disaster recovery. Organizations build and buy numerous tools and utilities for that purpose.

ClusterControl differs from the usual approach of trying to bolt together performance monitoring, automatic failover and backup management tools by combining – in one product – everything you need to deploy and operate mission-critical databases in production. It automates the entire database environment, and ultimately delivers an agile, modern and highly available data platform based on open source.

All-in-one management software - the ClusterControl features set:

Since the inception of Severalnines, we have made it our mission to provide market-leading solutions to help organisations achieve optimal efficiency and availability of their open source database infrastructures.

With ClusterControl, as it stands today, we are proud to say: mission accomplished!

Our flagship product is an integrated deployment, monitoring, and management automation system for open source databases, which provides holistic, real-time control of your database operations in an easy and intuitive experience, incorporating the best practices learned from thousands of customer deployments in a comprehensive system that helps you manage your databases safely and reliably.

Whether you’re a MySQL, MariaDB, PostgreSQL or MongoDB user (or a combination of these), ClusterControl has you covered.

Deploying, monitoring and managing highly available open source database clusters is not a small feat and requires either just as highly specialised database administration (DBA) skills … or professional tools and systems that non-DBA users can wield in order to build and maintain such systems, though these typically come with an equally high learning curve.

The idea and concept for ClusterControl was born out of that conundrum that most organisations face when it comes to running highly available database environments.

It is the only solution on the market today that provides that intuitive, easy to use system with the full set of tools required to manage such complex database environments end-to-end, whether one is a DBA or not.

The aim of this Guide is to make the case for comprehensive open source database management and the need for cluster management software. And explains in a just as comprehensive fashion why ClusterControl is the only management system you will ever need to run highly available open source database infrastructures.

Download ClusterControl - The Guide!

A Developer’s Guide to MongoDB Sharding

$
0
0

A massive growth of data comes with a cost of reduced throughput operations especially when being served by a single server. However, you can improve this performance by increasing the number of servers and also distributing your data on multiple numbers of these servers. In this article, Replica sets in MongoDB, we discussed in detail how the throughput operations can be improved besides ensuring high availability of data. This process cannot be achieved completely without mentioning Sharding in MongoDB.

What is Sharding in MongoDB

MongoDB is designed in a flexible manner such that it is scalable for you to run in a cluster across a distributed platform. In this platform, data is distributed across a number of servers for storage. This process is what is termed as sharding. If a single server is subjected to a large amount of data for storage, you might run out of the storage space. In addition, very critical throughput operations such as read and write can be affected to a large extent. The horizontal scaling feature in MongoDB enables us to distribute data across multiple machines with an end result of improving load balancing.

MongoDB Shards

A shard can be considered to be a replica set that hosts some data subset used in a sharded cluster. For a given mongod instance with some set of data, the data is split and distributed across a number of databases in this case shards. Basically, a number of different shards serve as independent databases but collectively they make up a logical database. Shards reduce the workload that is to be performed by the entire database by reducing the number of operations a shard should handle besides the lesser amount of data this shard will host. This metric gives room for the expansion of a cluster horizontally. A simple architecture of sharding is shown below.

Data sent from a client application is intercepted by server drivers and then fed to the router. The router will then consult the server configurations to determine where to apply the read or write operation on the shard servers. In a nutshell, for an operation such as write, it has some index which will dictate to which shard is the record to be the host. Let’s say a database has 1TB data capacity distributed across 4 shards, each shard will hold 256GB of this data. With a reduced amount of data a shard can handle, operations can be performed quite fast. You should consider using the sharded cluster in your database when:

  1. You expect the amount of data to outdo your single instance storage capacity in future.
  2. If the write operations fail to be performed by the single MongodB instance
  3. You run out of the Random Access Memory RAM at the expense of increased size of the active working set.

Sharding comes with increased complexity in the architecture besides additional resources. However, it is advisable to do sharding at early stages before your data outgrows since it is quite tedious to do so when your data is beyond capacity.

MongoDB Shard Key

As we all know, a document in MongoDB has fields for holding values. When you are deploying a sharding, you will be required to select a field from a collection which you will use to split the data. This field you selected is the shard key which determines how you are going to split the documents in the collection across a number of shards. In a simple example, your data may have field names students, class teachers, and marks. You may decide one shard set to contain the documents with the index student, another one teachers, and marks. However, you may require your data to be distributed randomly hence use a hashed shard key. There is a range of shard keys used in splitting data besides the hashed shard key but the two main categories are indexed field and indexed compound fields.

Choosing a Shard Key

For better functionality, capability and performance of the sharding strategy, you will need to select the appropriate sharded key. The selecting criteria are dependent on 2 factors:

  1. Schema structure of your data. We can for example consider a field whose value could be increasing or decreasing (changing monotonically). This will most likely influence to a distribution of inserts to a single shard within a cluster.
  2. How your querying configurations are featured to perform write operations.

What is a Hashed Shard Key

This uses a hashed index of a single field as the shard key. A hashed index is an index that maintains entries with hashes of the values of an indexed field.i.e

{
    "_id" :"5b85117af532da651cc912cd"
}

To create a hashed index you can use this command in the mongo shell.

db.collection.createIndex( { _id: hashedValue } )

Where the hashedValue variable represents a string of your specified hash value. Hashed sharding promotes even data distribution across a sharded cluster thereby reducing target operations. However, documents with almost same shard keys may unlikely be on the same shard hence requiring a mongo instance to do a broadcast operation in satisfying a given query criterion.

Range-Based Shard key

In this category, the dataset is partitioned based on value ranges of a chosen field key hence a high range of partitions. I.e. if you have a numeric key whose values run from negative infinity to positive infinity, each shard key will fall on certain point within that line. This line is divided into chunks with each chunk having a certain range of values. Precisely, those documents with almost similar shard key are hosted in the same chunk. The advantage with this technique is that it supports a range of queries since the router will select the shard with the specific chunk.

Characteristics of an Optimal Shard Key

  1. An ideal shard key should be able to target a single shard in order to enhance a mongos program to return query operations from a single mongod instance. The key being primary field characterizes this. I.e. not in an embedded document.
  2. Have a high degree of randomness. This is to say, the field should be available in most of the documents. This will ensure write operations are distributed within a shard.
  3. Be easily divisible. With an easily divisible shard key, there is increased data distribution hence more shards.
Severalnines
 
Become a MongoDB DBA - Bringing MongoDB to Production
Learn about what you need to know to deploy, monitor, manage and scale MongoDB

Components of a Production Cluster Deployment

Regarding the architecture shown above, the production shard cluster should have:

  • Mongos/ Query routers. These are mongo instances that act as a server between application drivers and the database itself. In deployment, the load balancer is configured so as to enable connection from a single client to reach the same mongos.
  • Shards. These are the partitions within which documents sharing the same shard key definition are hosted. You should have at least 2 in order to increase the availability of data.
  • Config Servers: you can either have 3 separate config servers in different machines or a group of them if you will be having multiple sharded clusters.

Deployment of a Sharded Cluster

The following steps will give you a clear direction towards deploying your sharded cluster.

  1. Creating host for the config servers. By default, the server files are available in the /data/configdb directory but you can always set this to your preferred directory. The command for creating the data directory is:

    $ mkdir /data/configdb
  2. Start the config servers by defining the port and file path for each using the command

    $ mongod --configsvr --dbpath /data/config --port 27018

    This command will start the configuration file in the data directory with the name config on port 27018. By default all MongoDB servers run on port 27017.

  3. Start a mongos instance using the syntax:

    $ mongo --host hostAddress --port 27018.

    The hostAddress variable will have the value for the hostname or ip address of your host.

  4. Start mongod on the shard server and initiate it using the command:

    mongod --shardsvr --replSet
    rs.initiate()
  5. Start your mongos on the router with the command:

    mongos --configdb rs/mongoconfig:27018
  6. Adding shards to your cluster. Let’s say we have the default port to be 27017 as our cluster, we can add a shard on port 27018 like this:

    mongo --host mongomaster --port 27017
    sh.addShard( "rs/mongoshard:27018")
    { "shardAdded" : "rs", "ok" : 1 }
  7. Enable sharding for the database using the shard name with the command:

    sh.enableSharding(shardname)
    { "ok" : 1 }

    You can check the status of the shard with the command:

    sh.status()

    You will be presented with this information

    sharding version: {
    "_id" : 1,
    "minCompatibleVersion" : 5,
    "currentVersion" : 6,
    "clusterId" : ObjectId("59f425f12fdbabb0daflfa82")
    }
    shards:
    { "_id" : "rs", "host" : "rs/mongoshard:27018", "state" : 1 }
    active mongoses:
    "3.4.10" : 1
    autosplit:
    Currently enabled: yes
    balancer:
    Currently enabled: yes
    Currently running: no
    NaN
    Failed balancer rounds in last 5 attempts: 0
    Migration Results for the last 24 hours:
    No recent migrations
    databases:
    { "_id" : shardname, "primary" : "rs", "partitioned" : true }

Shard Balancing

After adding a shard to a cluster, you might observe that some shards may still be hosting more data than other and to be more secant the new shard will have no data. You therefore need to run some background checks in order to ensure load balance. Balancing is the basis for which data is redistributed in a cluster. The balancer will detect an uneven distribution hence migrate chunks from one shard to another until a balance quorum is reached.

The balancing process consumes plenty of bandwidth besides workload overheads and this will affect the operation of your database. A better balancing process involves:

  • Moving a single chunk at a time.
  • Do the balancing when the migrations threshold is reached, that is when the difference between the lowest numbers of chunks for a given collection and the highest number of chunks in the sharded collection.

Webinar: Backup Management for MySQL, MariaDB, PostgreSQL & MongoDB with ClusterControl

$
0
0

Are you frustrated with traditional, labour-intensive backup and archive practices for your MySQL, MariaDB, MongoDB and PostgreSQL databases?

What if you could have one backup management solution for all your business data? What if you could ensure integrity of all your backups? And what if you could leverage the competitive pricing and almost limitless capacity of cloud-based backup while meeting cost, manageability, and compliance requirements from the business?

Welcome to our webinar on Backup Management with ClusterControl on November 13th 2018.

Whether you are looking at rebuilding your existing backup infrastructure, or updating it, this webinar is for you.

ClusterControl’s centralized backup management for open source databases provides you with hot backups of large datasets, point in time recovery in a couple of clicks, at-rest and in-transit data encryption, data integrity via automatic restore verification, cloud backups (AWS, Google and Azure) for Disaster Recovery, retention policies to ensure compliance, and automated alerts and reporting.

Date, Time & Registration

Europe/MEA/APAC

Tuesday, November 13th at 09:00 GMT / 10:00 CET (Germany, France, Sweden)

Register Now

North America/LatAm

Tuesday, November 13th at 09:00 PST (US) / 12:00 EST (US)

Register Now

Agenda

  • Backup and recovery management of local or remote databases
    • Logical or physical backups
    • Full or Incremental backups
    • Position or time-based Point in Time Recovery (for MySQL and PostgreSQL)
    • Upload to the cloud (Amazon S3, Google Cloud Storage, Azure Storage)
    • Encryption of backup data
    • Compression of backup data
  • One centralized backup system for your open source databases (Demo)
    • Schedule, manage and operate backups
    • Define backup policies, retention, history
    • Validation - Automatic restore verification
    • Backup reporting

Speaker

Bartlomiej Oles is a MySQL and Oracle DBA, with over 15 years experience in managing highly available production systems at IBM, Nordea Bank, Acxiom, Lufthansa, and other Fortune 500 companies. In the past five years, his focus has been on building and applying automation tools to manage multi-datacenter database environments.

Linking & Creating MongoDB Joins Using SQL - Part 1

$
0
0

SQL is the most preferred way of engaging relational databases as far as querying is concerned. It’s understood that users would have worked with relational databases such as MySQL and PostgreSQL that employ the SQL querying feature. Generally, SQL is easy to understand and therefore became widely used especially in relational databases.

However, SQL is quite complex when trying to engage a wide set of documents in a database. In a nutshell, it is not intended for document databases as it comes with a number of setbacks. For instance, you cannot query embedded array documents with ease or rather you will need to design a subprogram to iterate and filter returned data to give required results. Consequently, this will result in an increment of the execution duration. But having a good understanding in SQL will provide a better ground in interacting with MongoDB from some point rather than starting from scratch.

In this blog, we will be using the Studio 3T program to show the various SQL join queries and how you can redesign them into MongoDB queries to achieve better performance. The program can be downloaded from this link.

Connecting SQL to MongoDB

There are several drivers or rather interfaces through which you can use SQL to communicate with MongoDB, for example, ODBC. ODBC stands for Open Database Connectivity. This is simply an interface that allows applications to access data in database management systems using SQL as the standard process of accessing that data. It comes with an added interoperability advantage whereby a single application can access multiple database management systems.

In this blog, we will produce and test code from SQL and then optimize it via an aggregation editor to produce a MongoDB query.

Mapping Chart for SQL to MongoDB

Before we go into much details, we need to understand the basic relations between these 2 databases especially keywords in the querying concept.

Terminology and Concepts

SQLMongoDB
Table
Row
Column
Table joins
Collection
BSON document
Field
$lookup

The primary key in SQL defines a unique column that basically arranges the rows in order of record time. On the other hand, the primary key in MongoDB is a unique field for holding a document and ensuring that indexed fields do not store duplicate values.

Severalnines
 
Become a MongoDB DBA - Bringing MongoDB to Production
Learn about what you need to know to deploy, monitor, manage and scale MongoDB

Correlation Between SQL and MongoDB

Let’s say we have a student data and we want to record this data in both SQL database and MongoDB. We can define a simple student object as:

{
    name: ‘James Washington’,
    age: 15,
    grade: A,
    Score: 10.5
}

In creating an SQL table, we need to define the column names and data type whereas in MongoDB a collection will be automatically be created during the first insertion.

The table below will help us understand how some of the SQL statement can be written in MongoDB.

SQL schema statementMongoDB Schema Statements
CREATE TABLE students (
  id MEDIUMINT NOT NULL AUTO_INCREMENT,
  name Varchar (30),
  age Number,
  score Float
)

To insert a document to the database

INSERT INTO students(Name, age, grade,score) VALUES(“James Washington”, 15, “A”, 10.5)

We can define a schema design using some modules such as mongoose and define the fields like an object rather than inserting a document directly to show the correlation. The primary filed id will be generated automatically during the insertion of a document.

{
  name: String,
  age Number,
  score: Number
}

Inserting a new document to create the collection

db.students.insertOne({
    name: ‘James Washington’,
    age: 15,
    grade: ‘A’,
    score: 10.5
})

Using the ADD statement to add a new column to the existing table.

ALTER TABLE students ADD units 10

The structure of collection documents is not well defined and therefore update documents at document level using the updateMany()

db.students.updateMany({}, {$set: {units: 10}})

To drop a column (units)

ALTER TABLE students DROP COLUMN units

To drop a field (units)

db.students.updateMany({}, {$unset: {units: “”}})

To drop a table students

DROP TABLE students

To drop collection students

db.students.drop()
SQL Select statementMongoDB find Statements

Select all rows

SELECT * FROM students

Select all documents

db.students.find()

To return specific columns only.

SELECT name, grade FROM students

To return specific fields only. By default, the _id field is returned unless specified otherwise in the projection process.

db.students.find({}, {name: 1, grade: 1, _id: 0})

Setting the _id: 0 mean only the document returned will have the name and the grade object values only.

To select specific row(s) with some matching column value.

SELECT * FROM students WHERE grade = “A”

To select specific document(s) with some matching field value.

db.students.find({grade: “A”})

Selecting rows with a column whose values has some characters as the supplied criteria value

SELECT * FROM students WHERE name like  “James%”

Selecting documents with a field whose values has some characters as the supplied criteria value

db.students.find({grade: {$regex: /^James/}})

To return the rows in an ascending order using the primary key.

SELECT * FROM students ORDER BY id ASC

To return the documents in an ascending using the primary key

db.students.find().sort({$natural: 1})

To group returned rows in accordance to some column (grade)

SELECT DISTINCT (grade) FROM students

To group returned documents in accordance to some field (grade)

db.students.aggregate([
{$group: : {_id: “$grade”}}
]

Limiting the number of returned rows and skipping some

SELECT * FROM students LIMIT 1 SKIP 4

Limiting the number of returned documents and skipping rows

db.students.find.limit(1).skip(4)

An essentials option is to know how our query is executed hence use the explain method.

EXPLAIN SELECT *  FROM students WHERE grade “A”
db.students.find({grade: “A”}).explain()
SQL Update statementMongoDB update Statements

Update the grade column for students whose age is equal to 15 or greater

UPDATE students SET grade  = “B” WHERE age >= 15

Here we use some operators such as $gt, $lt and $lte.

db.students.updateMany({age: {$gte: 15}}, {$set: {status: “B”}})

Incrementing some column value

UPDATE students SET age  = age + 1 WHERE age < 15
db.students.updateMany({
age: {$lt:15}},{$inc: {age: 1}})
SQL delete statementMongoDB remove Statements

To delete all rows

DELETE FROM students

To delete all documents.

db.students.remove({})

To delete a specific row where some column has a specific value.

DELETE FROM students WHERE age = 15
db.students.remove({age: 15})

This sample mapping table will enable you to get a better understanding of what we are going to learn in our next topic.

SQL and Studio 3T

Studio 3T is one of the available programs that helps to connect SQL and MongoDB. It has a SQL Query feature for enhancing one to manipulate SQL. The query is interpreted into Mongo shell to produce a simple query code in MongoDB language equivalent. Besides doing simple queries, the Studio 3T application can now do joins.

For our sample data above, after connecting your database in Studio 3T, we can use the SQL window to find the document that matches our criteria i.e.:

SELECT * FROM students  WHERE name LIKE  'James%';

If you have a document with name field set to value James, then it will be returned. Likewise, if you click on the query code tab, you will be presented with a window with the equivalent MongoDB code. For the statement above, we will have:

db.getCollection("students").find(
    { 
        "name" : /^James.*$/i
    }
);

Summary

Sometimes you may want a quick way of interacting with MongoDB from the knowledge you have on SQL. We have learnt some basic code similarities between SQL and its equivalent in MongoDB. Further, some programs such as Studio 3T have well established tools for converting the SQL query into MongoDB equivalent language and fine-tune this query for better results. Well, to most of us, this will be a great tool for making our work easy and ensuring whatever code we have in the end is very optimal for the performance of our database. In Part 2 of this blog, we are going to learn about SQL INNER JOIN in MongoDB.


Linking & Creating MongoDB Joins Using SQL - Part 2

$
0
0

JOIN is one of the key distinct features between SQL and NoSQL databases. In SQL databases, we can perform a JOIN between two tables within the same or different databases. However, this is not the case for MongoDB as it allows JOIN operations between two collections in the same database.

The way data is presented in MongoDB makes it almost impossible to relate it from one collection to another except when using basic script query functions. MongoDB either de-normalizes data by storing related items in a separate document or it relates data in some other separate document.

One could relate this data by using manual references such as the _id field of one document that is saved in another document as a reference. Nevertheless, one needs to make multiple queries in order to fetch for some required data, making the process a bit tedious.

We therefore resolve to using the JOIN concept which facilitates the relation of the data. JOIN operation in MongoDB is achieved through the use of $lookup operator, which was introduced in version 3.2.

$lookup operator

The main idea behind the JOIN concept is to get correlation between data in one collection to another. The basic syntax of $lookup operator is:

{
   $lookup:
     {
       from: <collection to join>,
       localField: <field from the input documents>,
       foreignField: <field from the documents of the "from" collection>,
       as: <output array field>
     }
}

Regarding the SQL knowledge, we always know that the result of a JOIN operation is a separate row linking all fields from the local and foreign table. For MongoDB, this is a different case in that the result documents are added as an array of local collection document. For example, let’s have two collections; ‘students’ and ‘units’

students

{"_id" : 1,"name" : "James Washington","age" : 15.0,"grade" : "A","score" : 10.5}
{"_id" : 2,"name" : "Clinton Ariango","age" : 14.0,"grade" : "B","score" : 7.5}
{"_id" : 3,"name" : "Mary Muthoni","age" : 16.0,"grade" : "A","score" : 11.5}

Units

{"_id" : 1,"Maths" : "A","English" : "A","Science" : "A","History" : "B"}
{"_id" : 2,"Maths" : "B","English" : "B","Science" : "A","History" : "B"}
{"_id" : 3,"Maths" : "A","English" : "A","Science" : "A","History" : "A"}

We can retrieve the students units with respective grades using the $lookup operator with the JOIN approach .i.e

db.getCollection('students').aggregate([{
$lookup:
    {
        from: "units",
        localField: "_id",
        foreignField : "_id",
        as: "studentUnits"
    }
}])

Which will give us the results below:

{"_id" : 1,"name" : "James Washington","age" : 15,"grade" : "A","score" : 10.5,
    "studentUnits" : [{"_id" : 1,"Maths" : "A","English" : "A","Science" : "A","History" : "B"}]}
{"_id" : 2,"name" : "Clinton Ariango","age" : 14,"grade" : "B","score" : 7.5,
    "studentUnits" : [{"_id" : 2,"Maths" : "B","English" : "B","Science" : "A","History" : "B"}]}
{"_id" : 3,"name" : "Mary Muthoni","age" : 16,"grade" : "A","score" : 11.5,
    "studentUnits" : [{"_id" : 3,"Maths" : "A","English" : "A","Science" : "A","History" : "A"}]}

Like mentioned before, if we do a JOIN using the SQL concept, we will be returned with separate documents in the Studio3T platform .i.e

SELECT *
  FROM students
    INNER JOIN units
      ON students._id = units._id

Is an equivalent of

db.getCollection("students").aggregate(
    [
        { 
            "$project" : {
                "_id" : NumberInt(0), 
                "students" : "$$ROOT"
            }
        }, 
        { 
            "$lookup" : {
                "localField" : "students._id", 
                "from" : "units", 
                "foreignField" : "_id", 
                "as" : "units"
            }
        }, 
        { 
            "$unwind" : {
                "path" : "$units", 
                "preserveNullAndEmptyArrays" : false
            }
        }
    ]
);

The above SQL query will return the results below:

{ "students" : {"_id" : NumberInt(1),"name" : "James Washington","age" : 15.0,"grade" : "A","score" : 10.5}, 
    "units" : {"_id" : NumberInt(1),"Maths" : "A","English" : "A","Science" : "A","History" : "B"}}
{ "students" : {"_id" : NumberInt(2), "name" : "Clinton Ariango","age" : 14.0,"grade" : "B","score" : 7.5 }, 
    "units" : {"_id" : NumberInt(2),"Maths" : "B","English" : "B","Science" : "A","History" : "B"}}
{ "students" : {"_id" : NumberInt(3),"name" : "Mary Muthoni","age" : 16.0,"grade" : "A","score" : 11.5},
"units" : {"_id" : NumberInt(3),"Maths" : "A","English" : "A","Science" : "A","History" : "A"}}

The performance duration will obviously be dependent on the structure of your query. For instance, if you have many documents in one collection over the other, you should do the aggregation from the collection with lesser documents and then lookup in the one with more documents. This way, a lookup for the chosen field from the lesser documents collection is quite optimal and takes lesser time than doing multiple lookups for a chosen field in the collection with more documents. It is therefore advisable to put the smaller collection first.

For a relational database, the order of the databases does not matter since most SQL interpreters have optimizers, which have access to extra information for deciding which one should be first.

In the case of MongoDB, we will need to use an index to facilitate the JOIN operation. We all know that all MongoDB documents have an _id key which for a relational DBM can be considered as the primary key. An index provides a better chance of reducing the amount of data that needs to be accessed besides supporting the operation when used in the $lookup foreign key.

In the aggregation pipeline, to use an index, we must ensure the $match is done first stage in order to filter out documents that do not match the criteria. For example if we want to retrieve the result for the student with _id field value equal to 1:

select * 
from students 
  INNER JOIN units 
    ON students._id = units._id 
      WHERE students._id = 1;

The equivalent MongoDB code you will get in this case is:

db.getCollection("students").aggregate(
[{"$project" : { "_id" : NumberInt(0), "students" : "$$ROOT" }}, 
     {  "$lookup" : {"localField" : "students._id", "from" : "units",  "foreignField" : "_id",  "as" : "units"} }, 
     { "$unwind" : { "path" : "$units","preserveNullAndEmptyArrays" : false } }, 
      { "$match" : {"students._id" : NumberLong(1) }}
    ]);

The returned result for the query above will be:

{"_id" : 1,"name" : "James Washington","age" : 15,"grade" : "A","score" : 10.5,
    "studentUnits" : [{"_id" : 1,"Maths" : "A","English" : "A","Science" : "A","History" : "B"}]}

When we don’t use the $match stage or rather not at the first stage, if we check with the explain function, we will get the COLLSCAN stage also included. Doing a COLLSCAN for a large set of documents will generally take a lot of time. We thereby resolve to using an index field which in the explain function involves the IXSCAN stage only. The latter has an advantage since we are checking on an index in the documents and not scanning through all the documents; it will not take long to return the results. You may have a different data structure like:

{    "_id" : NumberInt(1), 
    "grades" : {"Maths" : "A", "English" : "A",  "Science" : "A", "History" : "B"
    }
}

We may want to return the grades as different entities in an array rather than a whole embedded grades field.

After writing the SQL query above, we need to modify the resulting MongoDB code. To do so, click on the copy icon on the right as below to copy the aggregation code:

Next go to the aggregation tab and on the presented pane, there is a paste icon, click it to paste the code.

Click the $match row and then the green up-arrow to move the stage to top as the first stage. However, you will need to create an index in your collection first like:

db.students.createIndex(
   { _id: 1 },
   { name: studentId }
)

You will get the code sample below:

db.getCollection("students").aggregate(
    [{ "$match" : {"_id" : 1.0}},
  { "$project" : {"_id" : NumberInt(0),"students" : "$$ROOT"}}, 
      { "$lookup" : {"localField" : "students._id","from" : "units","foreignField" : "_id","as" : "units"}}, 
      { "$unwind" : {"path" : "$units", "preserveNullAndEmptyArrays" : false}}
    ]
Severalnines
 
Become a MongoDB DBA - Bringing MongoDB to Production
Learn about what you need to know to deploy, monitor, manage and scale MongoDB

With this code we will get the result below:

{ "students" : {"_id" : NumberInt(1), "name" : "James Washington","age" : 15.0,"grade" : "A", "score" : 10.5}, 
    "units" : {"_id" : NumberInt(1), "grades" : {"Maths" : "A", "English" : "A", "Science" : "A",  "History" : "B"}}}

But all we need is to have the grades as a separate document entity in the returned document and not as the above example. We will hence add the $addfields stage hence the code as below.

db.getCollection("students").aggregate(
    [{ "$match" : {"_id" : 1.0}},
  { "$project" : {"_id" : NumberInt(0),"students" : "$$ROOT"}}, 
      { "$lookup" : {"localField" : "students._id","from" : "units","foreignField" : "_id","as" : "units"}}, 
      { "$unwind" : {"path" : "$units", "preserveNullAndEmptyArrays" : false}},
      { "$addFields" : {"units" : "$units.grades"} }]

The resulting documents will then be:

{
"students" : {"_id" : NumberInt(1), "name" : "James Washington", "grade" : "A","score" : 10.5}, 
     "units" : {"Maths" : "A", "English" : "A",  "Science" : "A", "History" : "B"}
}

The returned data is quite neat, as we have eliminated embedded documents from the units’ collection as a separate field.

In our next tutorial, we are going to look into queries with several joins.

Percona Live Frankfurt 2018 - Event Recap & Our Sessions

$
0
0

Severalnines was pleased to yet again sponsor Percona Live Europe which was held this year in Frankfurt, Germany. Thanks to the Percona Team for having us and the great organisation.

At the Conference

Severalnines team members flew in from around the world to show off the latest edition of ClusterControl in the exhibit hall and present five sessions (see below).

On our Twitter feed we live tweeted both of the keynote sessions to help keep those who weren’t able to attend up-to-speed on the latest happenings in the open source database world.

Our Sessions

Members of the Severalnines Team presented five sessions in total at the event about MySQL, MariaDB & MongoDB, each of which showcased ClusterControl and how it delivers on those topics.

Disaster Recovery Planning for MySQL & MariaDB

Presented by: Bart Oles - Severalnines AB

Session Details: Organizations need an appropriate disaster recovery plan to mitigate the impact of downtime. But how much should a business invest? Designing a highly available system comes at a cost, and not all businesses and indeed not all applications need five 9's availability. We will explain fundamental disaster recovery concepts and walk you through the relevant options from the MySQL & MariaDB ecosystem to meet different tiers of disaster recovery requirements, and demonstrate how to automate an appropriate disaster recovery plan.

MariaDB Performance Tuning Crash Course

Presented by: Krzysztof Ksiazek - Severalnines AB

Session Details: So, you are a developer or sysadmin and showed some abilities in dealing with databases issues. And now, you have been elected to the role of DBA. And as you start managing the databases, you wonder

  • How do I tune them to make best use of the hardware?
  • How do I optimize the Operating System?
  • How do I best configure MySQL or MariaDB for a specific database workload?

If you're asking yourself the following questions when it comes to optimally running your MySQL or MariaDB databases, then this talk is for you!

We will discuss some of the settings that are most often tweaked and which can bring you significant improvement in the performance of your MySQL or MariaDB database. We will also cover some of the variables which are frequently modified even though they should not.

Performance tuning is not easy, especially if you're not an experienced DBA, but you can go a surprisingly long way with a few basic guidelines.

Performance Tuning Cheat Sheet for MongoDB

Presented by: Bart Oles - Severalnines AB

Session Details: Database performance affects organizational performance, and we tend to look for quick fixes when under stress. But how can we better understand our database workload and factors that may cause harm to it? What are the limitations in MongoDB that could potentially impact cluster performance?

In this talk, we will show you how to identify the factors that limit database performance. We will start with the free MongoDB Cloud monitoring tools. Then we will move on to log files and queries. To be able to achieve optimal use of hardware resources, we will take a look into kernel optimization and other crucial OS settings. Finally, we will look into how to examine performance of MongoDB replication.

Advanced MySql Data-at-Rest Encryption in Percona Server

Presented by: Iwo Panowicz - Percona & Bart Oles - Severalnines AB

Session Details: The purpose of the talk is to present data-at-rest encryption implementation in Percona Server for MySQL.
Differences between Oracle's MySQL and MariaDB implementation.

  • How it is implemented?
  • What is encrypted:
  • Tablespaces?
  • General tablespace?
  • Double write buffer/parallel double write buffer?
  • Temporary tablespaces? (KEY BLOCKS)
  • Binlogs?
  • Slow/general/error logs?
  • MyISAM? MyRocks? X?
  • Performance overhead.
  • Backups?
  • Transportable tablespaces. Transfer key.
  • Plugins
  • Keyrings in general
  • Key rotation?
  • General-Purpose Keyring Key-Management Functions
  • Keyring_file
  • Is useful? How to make it profitable?
  • Keyring Vault
  • How does it work?
  • How to make a transition from keyring_file

Polyglot Persistence Utilizing Open Source Databases as a Swiss Pocket Knife

Presented by: Art Van Scheppingen - vidaXL & Bart Oles - Severalnines AB

Session Details: Over the past few years, VidaXL has become a European market leader in the online retail of slow moving consumer goods. When a company achieved over 50% year over year growth for the past 9 years, there is hardly enough time to overhaul existing systems. This means existing systems will be stretched to the maximum of their capabilities, and often additional performance will be gained by utilizing a large variety of datastores. Polyglot persistence reigns in rapidly growing environments and the traditional one-size-fits-all strategy of monoglots is over. VidaXL has a broad landscape of datastores, ranging from traditional SQL data stores, like MySQL or PostgreSQL alongside more recent load balancing technologies such as ProxySQL, to document stores like MongoDB and search engines such as SOLR and Elasticsearch.

Linking & Creating MongoDB Joins Using SQL - Part 3

$
0
0

Multiple JOINS in a single query

Multiple JOINS are normally associated with multiple collections, but you must have a basic understanding of how the INNER JOIN works (see my previous posts on this topic). In addition to our two collections we had before; units and students, let’s add a third collection and label it sports. Populate the sports collection with the data below:

{
    "_id" : 1,"tournamentsPlayed" : 6,
    "gamesParticipated" : [{"hockey" : "midfielder","football" : "stricker","handball" : "goalkeeper"}],
    "sportPlaces" : ["Stafford Bridge","South Africa", "Rio Brazil"]
}
{
    "_id" : 2,"tournamentsPlayed" : 3,
    "gamesParticipated" : [{"hockey" : "goalkeeper","football" : "stricker", "handball" : "midfielder"}],
    "sportPlaces" : ["Ukraine","India", "Argentina"]
}
{
    "_id" : 3,"tournamentsPlayed" : 10,
    "gamesParticipated" : [{"hockey" : "stricker","football" : "goalkeeper","tabletennis" : "doublePlayer"}],
    "sportPlaces" : ["China","Korea","France"]
}

We would like, for example, to return all the data for a student with _id field value equal to 1. Normally, we would write a query to fetch for the _id field value from the students collection, then use the returned value to query for data in the other two collections. Consequently, this will not be the best option especially if a large set of documents is involved. A better approach would be to use the Studio3T program SQL feature. We can query our MongoDB with the normal SQL concept and then try to coarse tune the resulting Mongo shell code to suit our specification. For instance, let’s fetch all data with _id equal to 1 from all the collections:

SELECT  *
  FROM students
    INNER JOIN units
      ON students._id = units._id
    INNER JOIN sports
      ON students._id = sports._id
  WHERE students._id = 1;

The resulting document will be:

{ 
    "students" : {"_id" : NumberInt(1),"name" : "James Washington","age" : 15.0,"grade" : "A","score" : 10.5}, 
    "units" : {"_id" : NumberInt(1),"grades" : {Maths" : "A","English" : "A","Science" : "A","History" : "B"}
    }, 
    "sports" : {
        "_id" : NumberInt(1),"tournamentsPlayed" : NumberInt(6), 
        "gamesParticipated" : [{"hockey" : "midfielder", "football" : "striker","handball" : "goalkeeper"}], 
        "sportPlaces" : ["Stafford Bridge","South Africa","Rio Brazil"]
    }
}

From the Query code tab, the correspondent MongoDB code will be:

db.getCollection("students").aggregate(
    [{ "$project" : {"_id" : NumberInt(0),"students" : "$$ROOT"}}, 
        { "$lookup" : {"localField" : "students._id","from" : "units","foreignField" : "_id", "as" : "units"}}, 
        { "$unwind" : {"path" : "$units","preserveNullAndEmptyArrays" : false}}, 
        { "$lookup" : {"localField" : "students._id","from" : "sports", "foreignField" : "_id","as" : "sports"}}, 
        { "$unwind" : {"path" : "$sports", "preserveNullAndEmptyArrays" : false}}, 
        { "$match" : {"students._id" : NumberLong(1)}}
    ]
);

Looking into the returned document, personally I am not too happy with the data structure especially with embedded documents. As you can see, there are _id fields returned and for the units we may not need the grades field to be embedded inside the units.

We would want to have a units field with embedded units and not any other fields. This leads us to the coarse tune part. Like in the previous posts, copy the code using the copy icon provided and go to the aggregation pane, paste the contents using the paste icon.

First things first, the $match operator should be the first stage, so move it to the first position and have something like this:

Click the first stage tab and modify the query to:

{
    "_id" : NumberLong(1)
}

We then need to modify the query further to remove many embedding stages of our data. To do so, we add new fields to capture data for the fields we want to eliminate i.e.:

db.getCollection("students").aggregate(
    [
        { "$project" : { "_id" : NumberInt(0), "students" : "$$ROOT"}}, 
        { "$match" : {"students._id" : NumberLong(1)}}, 
        { "$lookup" : { "localField" : "students._id", "from" : "units","foreignField" : "_id", "as" : "units"}}, 
        { "$addFields" : { "_id": "$students._id","units" : "$units.grades"}}, 
        { "$unwind" : { "path" : "$units",  "preserveNullAndEmptyArrays" : false}}, 
        { "$lookup" : {"localField" : "students._id", "from" : "sports", "foreignField" : "_id", "as" : "sports"}}, 
        { "$unwind" : { "path" : "$sports","preserveNullAndEmptyArrays" : false}}, 
        { "$project" : {"sports._id" : 0.0}}
        ]
);

As you can see, in the fine tuning process we have introduced new field units which will overwrite the contents of the previous aggregation pipeline with grades as an embedded field. Further, we have made an _id field to indicate that the data was in relation to any documents in the collections with the same value. The last $project stage is to remove the _id field in the sports document such that we may have a neatly presented data as below.

{  "_id" : NumberInt(1), 
    "students" : {"name" : "James Washington", "age" : 15.0,  "grade" : "A", "score" : 10.5}, 
    "units" : {"Maths" : "A","English" : "A", "Science" : "A","History" : "B"}, 
    "sports" : {
        "tournamentsPlayed" : NumberInt(6), 
        "gamesParticipated" : [{"hockey" : "midfielder","football" : "striker","handball" : "goalkeeper"}],  
        "sportPlaces" : ["Stafford Bridge", "South Africa", "Rio Brazil"]
        }
}

We can also restrict on which fields should be returned from the SQL point of view. For example we can return the student name, units this student is doing and the number of tournaments played using multiple JOINS with the code below:

SELECT  students.name, units.grades, sports.tournamentsPlayed
  FROM students
    INNER JOIN units
      ON students._id = units._id
    INNER JOIN sports
      ON students._id = sports._id
  WHERE students._id = 1;

This does not give us the most appropriate result. So as usual, copy it and paste in the aggregation pane. We fine tune with the code below to get the appropriate result.

db.getCollection("students").aggregate(
    [
        { "$project" : { "_id" : NumberInt(0), "students" : "$$ROOT"}}, 
        { "$match" : {"students._id" : NumberLong(1)}}, 
        { "$lookup" : { "localField" : "students._id", "from" : "units","foreignField" : "_id", "as" : "units"}}, 
        { "$addFields" : {"units" : "$units.grades"}}, 
        { "$unwind" : { "path" : "$units",  "preserveNullAndEmptyArrays" : false}}, 
        { "$lookup" : {"localField" : "students._id", "from" : "sports", "foreignField" : "_id", "as" : "sports"}}, 
        { "$unwind" : { "path" : "$sports","preserveNullAndEmptyArrays" : false}}, 
        { "$project" : {"name" : "$students.name", "grades" : "$units.grades", "tournamentsPlayed" : "$sports.tournamentsPlayed"}
        }}
        ]
);

This aggregation result from the SQL JOIN concept gives us a neat and presentable data structure shown below.

{ 
    "name" : "James Washington", 
    "grades" : {"Maths" : "A", "English" : "A", "Science" : "A", "History" : "B"}, 
    "tournamentsPlayed" : NumberInt(6)
}

Pretty simple, right? The data is quite presentable as if it was stored in a single collection as a single document.

LEFT OUTER JOIN

The LEFT OUTER JOIN is normally used to show documents that do not conform to the most portrayed relationship. The resulting set of a LEFT OUTER join contains all rows from both collections that meet the WHERE clause criteria, same as an INNER JOIN result set. Besides, any documents from the left collection that do not have matching documents in the right collection will also be included in the result set. The fields being selected from the right side table will return NULL values. However, any documents in the right collection, which do not have matching criteria from the left collection, are not returned.

Take a look at these two collections:

students

{"_id" : 1,"name" : "James Washington","age" : 15.0,"grade" : "A","score" : 10.5}
{"_id" : 2,"name" : "Clinton Ariango","age" : 14.0,"grade" : "B","score" : 7.5}
{"_id" : 4,"name" : "Mary Muthoni","age" : 16.0,"grade" : "A","score" : 11.5}

Units

{"_id" : 1,"Maths" : "A","English" : "A","Science" : "A","History" : "B"}
{"_id" : 2,"Maths" : "B","English" : "B","Science" : "A","History" : "B"}
{"_id" : 3,"Maths" : "A","English" : "A","Science" : "A","History" : "A"}

In the students collection we don’t have _id field value set to 3 but in the units collection we have. Likewise, there is no _id field value 4 in in the units collection. If we use the students collection as our left option in the JOIN approach with the query below:

SELECT *
  FROM students
    LEFT OUTER JOIN units
      ON students._id = units._id

With this code we will get the following result:

{
    "students" : {"_id" : 1,"name" : "James Washington","age" : 15,"grade" : "A","score" : 10.5},
    "units" : {"_id" : 1,"grades" : {"Maths" : "A","English" : "A", "Science" : "A","History" : "B"}}
}
{
    "students" : {"_id" : 2,"name" : "Clinton Ariango", "age" : 14,"grade" : "B", "score" : 7.5 }
}
{
    "students" : {"_id" : 3,"name" : "Mary Muthoni","age" : 16,"grade" : "A","score" : 11.5},
    "units" : {"_id" : 3,"grades" : {"Maths" : "A","English" : "A","Science" : "A","History" : "A"}}
}

The second document does not have the units field because there was no matching document in the units collection. For this SQL query, the correspondent Mongo Code will be

db.getCollection("students").aggregate(
    [
        { 
            "$project" : {"_id" : NumberInt(0), "students" : "$$ROOT"}}, 
        { 
            "$lookup" : {"localField" : "students._id",  "from" : "units", "foreignField" : "_id", "as" : "units"}
        }, 
        { 
            "$unwind" : { "path" : "$units", "preserveNullAndEmptyArrays" : true}
        }
    ]
);

Of course we have learnt about fine-tuning, so you can go ahead and restructure the aggregation pipeline to suite the end result you would like. SQL is a very powerful tool as far as database management is concerned. It is a broad subject on its own, you can also try to use the IN and the GROUP BY clauses to get the correspondent code for MongoDB and see how it works.

Conclusion

Getting used to a new (database) technology in addition to the one you are used to working with can take a lot of time. Relational databases are still more common than the non-relational ones. Nevertheless, with the introduction of MongoDB, things have changed and people would like to learn it as fast as possible because of its associated powerful performance.

Learning MongoDB from scratch can be a bit tedious, but we can use the knowledge of SQL to manipulate data in MongoDB, get the relative MongoDB code and fine tune it to get the most appropriate results. One of the tools that is available to enhance this is Studio 3T. It offers two important features that facilitate the operation of complex data, that is: SQL query feature and the Aggregation editor. Fine tuning queries will not only ensure you get the best result but also improve on the performance in terms of time saving.

Deploying MongoDB Using Docker

$
0
0

The main advantage of using MongoDB is that it’s easy to use. One can easily install MongoDB and start working on it in minutes. Docker makes this process even easier.

One cool thing about Docker is that, with very little effort and some configuration, we can spin up a container and start working on any technology. In this article, we will spin up a MongoDB container using Docker and learn how to attach the storage volume from a host system to a container.

Prerequisites for Deploying MongoDB on Docker

We will only need Docker installed in the system for this tutorial.

Creating a MongoDB Image

First create a folder and create a file with the name Dockerfile inside that folder:

$ mkdir mongo-with-docker
$ cd mongo-with-docker
$ vi Dockerfile

Paste this content in your Dockerfile:

FROM debian:jessie-slim
RUN apt-get update && \
apt-get install -y ca-certificates && \
rm -rf /var/lib/apt/lists/*
RUN gpg --keyserver ha.pool.sks-keyservers.net --recv-keys 0C49F3730359A14518585931BC711F9BA15703C6 && \
gpg --export $GPG_KEYS > /etc/apt/trusted.gpg.d/mongodb.gpg
ARG MONGO_PACKAGE=mongodb-org
ARG MONGO_REPO=repo.mongodb.org
ENV MONGO_PACKAGE=${MONGO_PACKAGE} MONGO_REPO=${MONGO_REPO}
ENV MONGO_MAJOR 3.4
ENV MONGO_VERSION 3.4.18
RUN echo "deb http://$MONGO_REPO/apt/debian jessie/${MONGO_PACKAGE%-unstable}/$MONGO_MAJOR main" | tee "/etc/apt/sources.list.d/${MONGO_PACKAGE%-unstable}.list"
RUN echo "/etc/apt/sources.list.d/${MONGO_PACKAGE%-unstable}.list"
RUN apt-get update
RUN apt-get install -y ${MONGO_PACKAGE}=$MONGO_VERSION
VOLUME ["/data/db"]
WORKDIR /data
EXPOSE 27017
CMD ["mongod", "--smallfiles"]

Then run this command to build your own MongoDB Docker image:

docker build -t hello-mongo:latest .

Understanding the Docker File Content

The structure of each line in docker file is as follows:

INSTRUCTIONS arguments
  • FROM: Base image from which we’ll start building the container
  • RUN: This commands executes all instructions to install MongoDB in the base image.
  • ARG: Stores some default values for the Docker build. These values are not available to the container. Can be overridden during the building process of the image using the --build-arg argument.
  • ENV: These values are available during the build phase as well as after launching the container. Can be overridden by passing the -e argument to docker run command.
  • VOLUME: Attaches the data/db volume to container.
  • WORKDIR: Sets the work directory to execute any RUN or CMD commands.
  • EXPOSE: Exposes the container’s port to host the system (outside world).
  • CMD: Starts the mongod instance in the container.
Severalnines
 
Become a MongoDB DBA - Bringing MongoDB to Production
Learn about what you need to know to deploy, monitor, manage and scale MongoDB

Starting the MongoDB Container From the Image

You can start the MongoDB container by issuing the following command:

docker run --name my-mongo -d -v /tmp/mongodb:/data/db -p 27017:27017 hello-mongo
  • --name: Name of the container.
  • -d: Will start the container as a background (daemon) process. Don’t specify this argument to run the container as foreground process.
  • -v: Attach the /tmp/mongodb volume of the host system to /data/db volume of the container.
  • -p: Map the host port to the container port.
  • Last argument is the name/id of the image.

To check whether the container is running or not, issue the following command:

docker ps

Output of this command should look like the following:

CONTAINER ID        IMAGE               COMMAND                 CREATED             STATUS              PORTS                      NAMES
a7e04bae0c53        hello-mongo         "mongod --smallfiles"   7 seconds ago       Up 6 seconds        0.0.0.0:27017->27017/tcp   my-mongo

Accessing MongoDB From the Host

Once the container is up and running, we can access it the same way as accessing the remote MongoDB instance. You can use any utility like Compass or Robomongo to connect to this instance. For now, I’ll use mongo command to connect. Run the following command in your terminal:

mongo 27017

It will open mongo shell where you can execute any mongo commands. Now we’ll create one database and add some data in it.

use mydb
db.myColl.insert({“name”: “severalnines”})
quit()

Now to check whether our volume mapping is correct or not, we will restart the container and check whether it has our data or not.

Docker restart <container_id>

Now again connect to mongo shell and run this command:

db.myColl.find().pretty()

You should see this result:

{ "_id" : ObjectId("5be7e05d20aab8d0622adf46"), "name" : "severalnines" }

This means our container is persisting the database data even after restarting it. This is possible because of volume mapping. The container will store all our data in /tmp/mongodb directory in the host system. So when you restart the container, all data inside the container will be erased and a new container will access the data from the host tmp/mongodb directory.

Accessing MongoDB Container Shell

$ docker exec -it <container-name> /bin/bash

Accessing MongoDB Container Logs

$ docker logs <container-name>

Connecting to the MongoDB Container From Another Container

You can connect to the MongoDB container from any other container using --link argument which follows the following structure.

--link <Container Name/Id>:<Alias>

Where Alias is an alias for link name. Run this command to link our Mongo container with express-mongo container.

docker run --link my-mongo:mongo -p 8081:8081 mongo-express

This command will pull the mongo-express image from dockerhub and start a new container. Mongo-express is an admin UI for MongoDB. Now go to http://localhost:8081 to access this interface.

Mongo-express Admin UI

Conclusion

In this article, we learned how to deploy a MongoDB image from scratch and how to create a MongoDB container using Docker. We also went through some important concepts like volume mapping and connecting to a MongoDB container from another container using links.

Docker eases the process of deploying multiple MongoDB instances. We can use the same MongoDB image to build any number of containers which can be used for creating Replica Sets. To make this process even smoother, we can write a YAML file (configuration file) and use docker-compose utility to deploy all the containers with the single command.

How to Use MongoDB Data Modeling to Improve Throughput Operations

$
0
0

The efficiency of a database not only relies on fine-tuning the most critical parameters, but also goes further to appropriate data presentation in the related collections. Recently, I worked on a project that developed a social chat application, and after a few days of testing, we noticed some lag when fetching data from the database. We did not have so many users, so we ruled out the database parameters tuning and focused on our queries to get to the root cause.

To our surprise, we realized our data structuring was not entirely appropriate in that we had more than 1 read requests to fetch some specific information.

The conceptual model of how application sections are put into place greatly depends on the database collections structure. For instance, if you log into a social app, data is fed into the different sections according to the application design as depicted from database presentation.

In a nutshell, for a well designed database, schema structure and collection relationships are key things towards its improved speed and integrity as we will see in the following sections.

We shall discuss the factors you should consider when modelling your data.

What is Data Modeling

Data modeling is generally the analysis of data items in a database and how related they are to other objects within that database.

In MongoDB for example, we can have a users collection and a profile collection. The users collection lists names of users for a given application whereas the profile collection captures the profile settings for each user.

In data modeling, we need to design a relationship for connecting each user to the correspondent profile. In a nutshell, data modeling is the fundamental step in database design besides forming the architecture basis for object-oriented programing. It also gives a clue on how the physical application will look like during development progress. An application-database integration architecture can be illustrated as below.

The Process of Data Modeling in MongoDB

Data modeling comes with improved database performance, but at the expense of some considerations which include:

  • Data retrieval patterns
  • Balancing needs of the application such as: queries, updates and data processing
  • Performance features of the chosen database engine
  • The Inherent structure of the data itself

MongoDB Document Structure

Documents in MongoDB play a major role in the decision making over which technique to apply for a given set of data. There are generally two relationships between data, which are:

  • Embedded Data
  • Reference Data

Embedded Data

In this case, related data is stored within a single document either as a field value or an array within the document itself. The main advantage of this approach is that data is denormalized and therefore provides an opportunity for manipulating the related data in a single database operation. Consequently, this improves the rate at which CRUD operations are carried out, hence fewer queries are required. Let’s consider an example of a document below:

{ "_id" : ObjectId("5b98bfe7e8b9ab9875e4c80c"),
     "StudentName" : "George  Beckonn",
        "Settings" : {
        "location" : "Embassy",
  "ParentPhone" : 724765986
        "bus" : "KAZ 450G",
        "distance" : "4",
        "placeLocation" : {
            "lat" : -0.376252,
            "lng" : 36.937389
        }
    }
}

In this set of data, we have a student with his name and some other additional information. The Settings field has been embedded with an object and further the placeLocation field is also embedded with an object with the latitude and longitude configurations. All data for this student has been contained within a single document. If we need to fetch all information for this student we just run:

db.students.findOne({StudentName : "George  Beckonn"})

Strengths of Embedding

  1. Increased data access speed: For an improved rate of access to data, embedding is the best option since a single query operation can manipulate data within the specified document with just a single database look-up.
  2. Reduced data inconsistency: During operation, if something goes wrong (for example a network disconnection or power failure) only a few numbers of documents may be affected since the criteria often select a single document.
  3. Reduced CRUD operations. This is to say, the read operations will actually outnumber the writes. Besides, it is possible to update related data in a single atomic write operation. I.e for the above data, we can update the phone number and also increase the distance with this single operation:
    db.students.updateOne({StudentName : "George  Beckonn"}, {
      $set: {"ParentPhone" : 72436986},
      $inc: {"Settings.distance": 1}
    })

Weaknesses of Embedding

  1. Restricted document size. All documents in MongoDB are constrained to the BSON size of 16 megabytes. Therefore, overall document size together with embedded data should not surpass this limit. Otherwise, for some storage engines such as MMAPv1, data may outgrow and result in data fragmentation as a result of degraded write performance.
  2. Data duplication: multiple copies of the same data make it harder to query the replicated data and it may take longer to filter embedded documents, hence outdo the core advantage of embedding.

Dot Notation

The dot notation is the identifying feature for embedded data in the programming part. It is used to access elements of an embedded field or an array. In the sample data above, we can return information of the student whose location is “Embassy” with this query using the dot notation.

db.users.find({'Settings.location': 'Embassy'})

Reference Data

The data relationship in this case is the related data is stored within different documents, but some reference link is issued to these related documents. For the sample data above we can reconstruct it in such a way that:

User document

{ "_id" : xyz,
     "StudentName" : "George  Beckonn",
     "ParentPhone" : 075646344,
}

Settings document

{   
     "id" :xyz,
     "location" : "Embassy",
     "bus" : "KAZ 450G",
     "distance" : "4",
     "lat" : -0.376252,
     "lng" : 36.937389
    
}

There are 2 different documents, but they are linked by the same value for the _id and id fields. The data model is thus normalized. However, for us to access information from a related document we need to issue additional queries and consequently this results in increased execution time. For instance, if we want to update the ParentPhone and the related distance settings we will have at least 3 queries i.e.

//fetch the id of a matching student
var studentId = db.students.findOne({"StudentName" : "George  Beckonn"})._id

//use the id of a matching student to update the ParentPhone in the Users document
db.students.updateOne({_id : studentId}, {
  $set: {"ParentPhone" : 72436986},
 })
//use the id of a matching student to update the distance in settings document

db.students.updateOne({id : studentId}, {
   $inc: {"distance": 1}
})

Strengths of Referencing

  1. Data consistency. For every document, a canonical form is maintained hence chances of data inconsistency are pretty low.
  2. Improved data integrity. Due to normalization, it is easy to update data regardless of operation duration length and therefore ensure correct data for every document without causing any confusion.
  3. Improved cache utilization. Canonical documents accessed frequently are stored in the cache rather than for embedded documents which are accessed a few times.
  4. Efficient hardware utilization. Contrary to embedding, which may result in document outgrow, referencing does not promote document growth thus reduces disk and RAM usage.
  5. Improved flexibility especially with a large set of subdocuments.
  6. Faster writes.

Weaknesses of Referencing

  1. Multiple lookups: Since we have to look in a number of documents that match criteria there is increased read time when retrieving from disk. Besides, this may result into cache misses.
  2. Many queries are issued to achieve some operation hence normalized data models require more round trips to the server to complete a specific operation.
Severalnines
 
Become a MongoDB DBA - Bringing MongoDB to Production
Learn about what you need to know to deploy, monitor, manage and scale MongoDB

Data Normalization

Data normalization refers to restructuring a database in accordance with some normal forms in order to improve data integrity and reduce events of data redundancy.

Data modeling revolves around 2 major normalization techniques that is:

  1. Normalized data models

    As applied in reference data, normalization divides data into multiple collections with references between the new collections. A single document update will be issued to the other collection and applied accordingly to the matching document. This provides an efficient data update representation and is commonly used for data that changes quite often.

  2. Denormalized data models

    Data contains embedded documents thereby making read operations quite efficient. However, it is associated with more disk space usage and also difficulties to keep in sync. The denormalization concept can be well applied to subdocuments whose data do not change quite often.

MongoDB Schema

A schema is basically an outlined skeleton of fields and data type each field should hold for a given set of data. Considering the SQL point of view, all rows are designed to have the same columns and each column should hold the defined data type. However, in MongoDB, we have a flexible Schema by default which does not hold the same conformity for all documents.

Flexible Schema

A flexible schema in MongoDB defines that the documents not necessarily need to have the same fields or data type, for a field can differ across documents within a collection. The core advantage with this concept is that one can add new fields, remove existing ones or change the field values to a new type and hence update the document into a new structure.

For example we can have these 2 documents in the same collection:

{ "_id" : ObjectId("5b98bfe7e8b9ab9875e4c80c"),
     "StudentName" : "George  Beckonn",
     "ParentPhone" : 75646344,
     "age" : 10
}
{ "_id" : ObjectId("5b98bfe7e8b9ab98757e8b9a"),
     "StudentName" : "Fredrick  Wesonga",
     "ParentPhone" : false,
}

In the first document, we have an age field whereas in the second document there is no age field. Further, the data type for ParentPhone field is a number whereas in the second document it has been set to false which is a boolean type.

Schema flexibility facilitates mapping of documents to an object and each document can match data fields of the represented entity.

Rigid Schema

As much as we have said that these documents may differ from one another, sometimes you may decide to create a rigid schema. A rigid schema will define that all documents in a collection will share the same structure and this will give you a better chance to set some document validation rules as a way of improving data integrity during insert and update operations.

Schema data types

When using some server drivers for MongoDB such as mongoose, there are some provided data types which enable you to do data validation. The basic data types are:

  • String
  • Number
  • Boolean
  • Date
  • Buffer
  • ObjectId
  • Array
  • Mixed
  • Decimal128
  • Map

Take a look of the sample schema below

var userSchema = new mongoose.Schema({
    userId: Number,
    Email: String,
    Birthday: Date,
    Adult: Boolean,
    Binary: Buffer,
    height: Schema.Types.Decimal128,
    units: []
   });

Example use case

var user = mongoose.model(‘Users’, userSchema )
var newUser = new user;
newUser.userId = 1;
newUser.Email = “example@gmail.com”;
newUser.Birthday = new Date;
newUser.Adult = false;
newUser.Binary = Buffer.alloc(0);
newUser.height = 12.45;
newUser.units = [‘Circuit network Theory’, ‘Algerbra’, ‘Calculus’];
newUser.save(callbackfunction);

Schema Validation

As much as you can do data validation from the application side, it is always good practice to do the validation from the server end, too. We achieve this by employing the schema validation rules.

These rules are applied during the insertion and update operations. They are declared on a collection basis during the creation process normally. However, you can also add the document validation rules to an existing collection using the collMod command with validator options but these rules are not applied to the existing documents until when an update applied to them.

Likewise, when creating a new collection using the command db.createCollection() you can issue the validator option. Take a look at this example when creating a collection for students. From version 3.6, MongoDB supports the JSON Schema validation hence all you need is to use the $jsonSchema operator.

db.createCollection("students", {
   validator: {$jsonSchema: {
         bsonType: "object",
         required: [ "name", "year", "major", "gpa" ],
         properties: {
            name: {
               bsonType: "string",
               description: "must be a string and is required"
            },
            gender: {
               bsonType: "string",
               description: "must be a string and is not required"
            },
            year: {
               bsonType: "int",
               minimum: 2017,
               maximum: 3017,
               exclusiveMaximum: false,
               description: "must be an integer in [ 2017, 2020 ] and is required"
            },
            major: {
               enum: [ "Math", "English", "Computer Science", "History", null ],
               description: "can only be one of the enum values and is required"
            },
            gpa: {
               bsonType: [ "double" ],
               minimum: 0,
               description: "must be a double and is required"
            }
         }
      
   }})

In this schema design, if we try to insert a new document like:

db.students.insert({
   name: "James Karanja",
   year: NumberInt(2016),
   major: "History",
   gpa: NumberInt(3)
})

The callback function will return the error below, because of some violated validation rules such as the supplied year value is not within the specified limits.

WriteResult({
   "nInserted" : 0,
   "writeError" : {
      "code" : 121,
      "errmsg" : "Document failed validation"
   }
})

Further, you can add query expressions to your validation option using query operators except $where, $text, near and $nearSphere, i.e.:

db.createCollection( "contacts",
   { validator: { $or:
      [
         { phone: { $type: "string" } },
         { email: { $regex: /@mongodb\.com$/ } },
         { status: { $in: [ "Unknown", "Incomplete" ] } }
      ]
   }
} )

Schema Validation Levels

As mentioned before, validation is issued to the write operations, normally.

However, validation can also be applied to already existing documents.

There are 3 levels of validation:

  1. Strict: this is the default MongoDB validation level and it applies validation rules to all inserts and updates.
  2. Moderate: The validation rules are applied during inserts, updates and to already existing documents that fulfill the validation criteria only.
  3. Off: this level sets the validation rules for a given schema to null hence no validation will be done to the documents.

Example:

Let’s insert the data below in a client collection.

db.clients.insert([
{
    "_id" : 1,
    "name" : "Brillian",
    "phone" : "+1 778 574 666",
    "city" : "Beijing",
    "status" : "Married"
},
{
    "_id" : 2,
    "name" : "James",
    "city" : "Peninsula"
}
]

If we apply the moderate validation level using:

db.runCommand( {
   collMod: "test",
   validator: { $jsonSchema: {
      bsonType: "object",
      required: [ "phone", "name" ],
      properties: {
         phone: {
            bsonType: "string",
            description: "must be a string and is required"
         },
         name: {
            bsonType: "string",
            description: "must be a string and is required"
         }
      }
   } },
   validationLevel: "moderate"
} )

The validation rules will be applied only to the document with _id of 1 since it will match all the criteria.

For the second document, since the validation rules are not met with the issued criteria, the document will not be validated.

Schema Validation Actions

After doing validation on documents, there may be some that may violate the validation rules. There is always a need to provide an action when this happens.

MongoDB provides two actions that can be issued to the documents that fail the validation rules:

  1. Error: this is the default MongoDB action, which rejects any insert or update in case it violates the validation criteria.
  2. Warn: This action will record the violation in the MongoDB log, but allows the insert or update operation to be completed. For example:

    db.createCollection("students", {
       validator: {$jsonSchema: {
             bsonType: "object",
             required: [ "name", "gpa" ],
             properties: {
                name: {
                   bsonType: "string",
                   description: "must be a string and is required"
                },
          
                gpa: {
                   bsonType: [ "double" ],
                   minimum: 0,
                   description: "must be a double and is required"
                }
             }
          
       },
    validationAction: “warn”
    })

    If we try to insert a document like this:

    db.students.insert( { name: "Amanda", status: "Updated" } );

    The gpa is missing regardless of the fact that it is a required field in the schema design, but since the validation action has been set to warn, the document will be saved and an error message will be recorded in the MongoDB log.

Severalnines 2018 Momentum: Raising the Bar on MySQL, MariaDB, PostgreSQL & MongoDB Management

$
0
0

I’d like to take advantage of the quiet days between holidays to look back on 2018 at Severalnines as we continue to advance automation and management of the world’s most popular open source databases: MySQL, MariaDB, PostgreSQL & MongoDB!

And take this opportunity to thank you all for your support in the past 12 months and celebrate some of our successes with you …

2018 Severalnines Momentum Highlights:

For those who don’t know about it yet, ClusterControl helps database users deploy, monitor, manage and scale SQL and NoSQL open source databases such as MySQL, MariaDB, PostgreSQL and MongoDB.

Automation and control of open source database infrastructure across mixed environments makes ClusterControl the ideal polyglot solution to support modern businesses - be they large or small.

The reason for ClusterControl’s popularity is the way it provides full operational visibility and control for open source databases.

But don’t take my word for it: we’ve published a year-end video this week that not only summarises our year’s achievements, but also includes customer and user quotes highlighting why they’ve chosen ClusterControl to help them administer their open source database infrastructure.

As a self-funded (mature) startup, our team’s focus is solely on solving pressing customer and community user needs. We do so with our product of course, but just as importantly also through our content contributions to the open source database community. We publish technical content daily that ranges from blogs to white papers, webinars and more.

These Are Our Top Feature & Content Hits in 2018

Top 3 New ClusterControl Features

SCUMM: agent-based monitoring infrastructure & dashboards

SCUMM - Severalnines CMON Unified Monitoring and Management - introduces new agent-based monitoring infrastructure with a server pulling metrics from agents that run on the same hosts as the monitored databases and uses Prometheus agents for greater accuracy and customization options while monitoring your database clusters.

Cloud database deployment

Introduces tighter integration with AWS, Azure and Google Cloud, so it is now possible to launch new instances and deploy MySQL, MariaDB, MongoDB and PostgreSQL directly from the ClusterControl user interface.

Comprehensive automation and management of PostgreSQL

Throughout the year, we’ve introduced a whole range of new features for PostgreSQL: from full backup and restore encryption for pg_dump and pg_basebackup, continuous archiving and Point-in-Time Recovery (PITR) for PostgreSQL, all the way to a new PostgreSQL performance dashboard.

Top 3 Most Read New Blogs

My Favorite PostgreSQL Queries and Why They Matter

Joshua Otwell presents a combination of eight differing queries or types of queries he has found interesting and engaging to explore, study, learn, or otherwise manipulate data sets.

A Performance Cheat Sheet for PostgreSQL

Sebastian Insausti discusses how one goes about analyzing the workload, or queries, that are running, as well as review some basic configuration parameters to improve the performance of PostgreSQL databases.

Deploying PostgreSQL on a Docker Container

Our team explains how to use Docker to run a PostgreSQL database.

Top 3 Most Downloaded White Papers

MySQL on Docker - How to Containerize the Dolphin

Covers the basics you need to understand when considering to run a MySQL service on top of Docker container virtualization. Although Docker can help automate deployment of MySQL, the database still has to be managed and monitored. ClusterControl can provide a complete operational platform for production database workloads.

PostgreSQL Management & Automation with ClusterControl

Discusses some of the challenges that may arise when administering a PostgreSQL database as well as some of the most important tasks an administrator needs to handle; and how to do so effectively … with ClusterControl. See how much time and effort can be saved, as well as risks mitigated, by the usage of such a unified management platform.

How to Design Highly Available Open Source Database Environments

Discusses the requirements for high availability in database setups, and how to design the system from the ground up for continuous data integrity.

Top 3 Most Watched Webinars

Our Guide to MySQL & MariaDB Performance Tuning

Watch as Krzysztof Książek, Senior Support Engineer at Severalnines, walks you through the ins and outs of performance tuning for MySQL and MariaDB, and share his tips & tricks on how to optimally tune your databases for performance.

Designing Open Source Databases for High Availability

From discussing high availability concepts through to failover or switch over mechanisms, this webinar covers all the need-to-know information when it comes to building highly available database infrastructures.

Backup Management for MySQL, MariaDB, PostgreSQL & MongoDB with ClusterControl

Whether you are looking at rebuilding your existing backup infrastructure, or updating it, then this webinar is for you: watch replay of this webinar on Backup Management for MySQL, MariaDB, PostgreSQL and MongoDB with ClusterControl.


Thanks again for your support this year and “see you” in 2019!

Happy New Year from everyone at Severalnines!

PS.: To join Severalnines’ growing customer base please click here

MongoDB in 2018 - A Year in Review

$
0
0

MongoDB is by far the most popular choice in NoSQL world as its distributed architecture allows for more scalability and its document data model provides good flexibility to developers. Almost every year, major MongoDB version is released and 2018 is no exception. MongoDB 4.0 was released in July 2018, followed by some other minor releases as well. With MongoDB version 4.0, multi-document transactions and type conversions are supported now. MongoDB introduced new tool called MongoDB charts(beta) and added support of aggregation pipeline builder in MongoDB compass as well in 2018. In this article, we will go through some exciting features of MongoDB which were released in 2018.

Multi-Document ACID Transactions

This was the most awaited feature in MongoDB. Starting from version 4.0, multi-document acid transactions against replica sets are production ready and supported by MongoDB. All MongoDB transactions now extend ACID properties which ensures data integrity. It is really easy to add acid-transactions in any application which needs them and they don’t affect other operations which don’t require them. With support of multi-document acid transactions, any write operation which is performed inside the transaction, won’t be visible outside of the transaction. Here are some useful commands to add multi-document acid transactions inside your application.

FunctionDescription
Session.startTransaction()Start a new transaction
Session.commitTransaction()Commits the transaction
Session.abortTransaction()Aborts the transaction

Here is a small example of adding transaction operations using Mongo shell:

akashk:PRIMARY> use mydb
akashk:PRIMARY> db.createCollection(“newColl”)
akashk:PRIMARY> session = db.getMongo().startSession()
akashk:PRIMARY> session { "id" : UUID("62525323-1cd1-4ee8-853f-b78e593b46ba") }
akashk:PRIMARY> session.startTransaction()
akashk:PRIMARY> session.getDatabase("mydb").newColl.insert({name : 'hello'})
akashk:PRIMARY> WriteResult({ "nInserted" : 1 })
akashk:PRIMARY> session.commitTransaction()

All transactions provide consistent view of data across one or many collections in database using snapshot isolation. MongoDB won’t push any uncommitted changes to secondary nodes/replicas. Once a transaction is committed, all the changes will be applied to secondary nodes.

There are many examples where we can use MongoDB multi-document acid transactions such as,

  • Funds transfer between bank accounts
  • Payment system
  • Trading system
  • Supply chain system
  • Billing system

Things to Consider While Adding Transactions

  1. MongoDB will abort any transaction which runs for more than 60 seconds.
  2. Not more than 1000 documents should be changed in a single transaction. No limit for read operations.
  3. Any transaction should be of size less than 16MB as MongoDb stores any transaction as a single entry in oplog.
  4. When you abort any transaction, all changes will be roll backed.

New Type Conversion Operators in Aggregation Pipeline

To get real-time insights of data and writing complex queries, MongoDB developers generally prefer to create aggregation pipeline. In MongoDB 4.0 version, some new aggregation type conversion operators have been added for querying data without cleansing of individual fields.

Aggregation operatorDescription
$convertConverts value to a specified type
$toDateConverts value to Date
$toDecimalConverts value to Decimal
$toDoubleConverts value to Double
$toLongConverts value to Long
$toIntConverts value to Integer
$toObjectIdConverts value to ObjectId
$toStringConverts value to String
$ltrimRemove unnecessary characters from the beginning of the string
$rtrimRemove unnecessary characters from the end of the string
$trimRemove unnecessary characters from both sides of the string
Severalnines
 
Become a MongoDB DBA - Bringing MongoDB to Production
Learn about what you need to know to deploy, monitor, manage and scale MongoDB

Extended Functionality of Change Streams

Functionality of change streams which provides real time data changes updates without any complex settings was introduced in version 3.6. With version 4.0, change streams can track changes of whole database or cluster instead of only a single collection now. Apart from this, now, change streams also returns cluster timestamp associated with an event which can be helpful for the server applications.

Faster Data Migrations

When your database is sharded across the cluster, adding and removing nodes elastically from a sharded cluster can be time consuming at some times. The sharded cluster balancer which is responsible to distribute data across all the shards, got major upgrade in version 4.0. Now, it can finish data migration at 40% faster rate.

Non-Blocking Secondary Reads

Previously, MongoDB used to block all the secondary reads when oplog entries were being applied to the secondary nodes. This was causing variable latency of secondary reads. From MongoDB 4.0, secondary reads have become non-blocking due to increased replica set throughput and improved read latencies.

Aggregation Pipeline Builder in Compass

MongoDB compass is the GUI tool for MongoDB to visualize and query data. This year, MongoDB compass got new feature of aggregation pipeline. It provides visual query editor for building multi stage aggregation pipelines. Here is the snapshot of it:

Aggregation query builder in Compass

In addition to this feature, compass also has the ability to export your queries to any native code languages of your choice now.

MongoDB Charts

MongoDB Charts is the new tool which enables the user to quickly create real time visualizations of MongoDB data. This tool is built for document data model with support of type handling, array reductions and nested documents as well. This tool allows user to create chart dashboards and share it with other users. MongoDB charts is now fully integrated with MongoDB Atlas.

Other New MongoDB Features

  • MongoDB Stitch: Serverless platform for client application development which can access Mongo services securely.
  • MongoDB Kubernetes: For deploying MongoDB within Kubernetes cluster.
  • MongoDB Mobile: Provides flexibility and power of MongoDB in a compact form so that it can be used in IOT devices.
  • MongoDB Monitoring Cloud Service: To push monitoring metadata to MongoDB monitoring cloud for free.

The Future of MongoDB

MongoDB also plans to launch some new features with its version 4.2 which includes,

  • More extensive WiredTiger engine
  • Transaction manager
  • Transactions across a sharded deployment
  • Global point in time reads

Announcing ClusterControl 1.7.1: Support for PostgreSQL 11 and MongoDB 4.0, Enhanced Monitoring

$
0
0

We are excited to announce the 1.7.1 release of ClusterControl - the only management system you’ll ever need to take control of your open source database infrastructure!

ClusterControl 1.7.1 introduces the next phase of our exciting agent-based monitoring features for MySQL, Galera Cluster, PostgreSQL & ProxySQL, a suite of new features to help users fully automate and manage PostgreSQL (including support for PostgreSQL 11), support for MongoDB 4.0 ... and more!

Release Highlights

Performance Management

  • Enhanced performance dashboards for MySQL, Galera Cluster, PostgreSQL & ProxySQL
  • Enhanced query monitoring for PostgreSQL: view query statistics

Deployment & Backup Management

  • Create a cluster from backup for MySQL & PostgreSQL
  • Verify/restore backup on a standalone PostgreSQL host
  • ClusterControl Backup & Restore

Additional Highlights

  • Support for PostgreSQL 11 and MongoDB 4.0

View the ClusterControl ChangeLog for all the details!

ClusterControl
Single Console for Your Entire Database Infrastructure
Find out what else is new in ClusterControl

View Release Details and Resources

Release Details

Performance Management

Enhanced performance dashboards for MySQL, Galera Cluster, PostgreSQL & ProxySQL

Since October 2018, ClusterControl users have access to a set of monitoring dashboards that have Prometheus as the data source with its flexible query language and multi-dimensional data model, where time series data is identified by metric name and key/value pairs.

The advantage of this new agent-based monitoring infrastructure is that users can enable their database clusters to use Prometheus exporters to collect metrics on their nodes and hosts, thus avoiding excessive SSH activity for monitoring and metrics collections and use SSH connectivity only for management operations.

These Prometheus exporters can now be installed or enabled Prometheus on your nodes and hosts with MySQL, PostgreSQL and MongoDB based clusters. And you have the possibility to customize collector flags for the exporters (Prometheus), which allows you to disable collecting from MySQL's performance schema for example, if you experience load issues on your server.

This allows for greater accuracy and customization options while monitoring your database clusters. ClusterControl takes care of installing and maintaining Prometheus as well as exporters on the monitored hosts.

With this 1.7.1 release, ClusterControl now also comes with the next iteration of the following (new) dashboards:

  • System Overview
  • Cluster Overview
  • MySQL Server - General
  • MySQL Server - Caches
  • MySQL InnoDB Metrics
  • Galera Cluster Overview
  • Galera Server Overview
  • PostgreSQL Overview
  • ProxySQL Overview
  • HAProxy Overview
  • MongoDB Cluster Overview
  • MongoDB ReplicaSet
  • MongoDB Server

Do check them out and let us know what you think!

MongoDB Cluster Overview
HAProxy Overview
HAProxy Overview

Performance Management

Advanced query monitoring for PostgreSQL: view query statistics

ClusterControl 1.7.1 now comes with a whole range of new query statistics that can easily be viewed and monitored via the ClusterControl GUI. The following statistics are included in this new release:

  • Access by sequential or index scans
  • Table I/O statistics
  • Index I/O statistics
  • Database Wide Statistics
  • Table Bloat And Index Bloat
  • Top 10 largest tables
  • Database Sizes
  • Last analyzed or vacuumed
  • Unused indexes
  • Duplicate indexes
  • Exclusive lock waits
Table Bloat & Index Bloat

Deployment

Create a cluster from backup for MySQL & PostgreSQL

To be able to deliver database and application changes more quickly, several tasks must be automated. It can be a daunting job to ensure that a development team has the latest database build for the test when there is a proliferation of copies, and the production database is in use.

ClusterControl provides a single process to create a new cluster from backup with no impact on the source database system.

With this new release, you can easily create MySQL Galera or PostgreSQL including the data from backup you need.

Backup Management

ClusterControl Backup/Restore

ClusterControl users can use this new feature to migrate a setup from one controller to another controller; and backup the meta-data of an entire controller or individual clusters from the s9s CLI. The backup can then be restored on a new controller with a new hostname/IP and the restore process will automatically recreate database access privileges. Check it out!

Additional New Functionalities

View the ClusterControl ChangeLog for all the details!

Download ClusterControl today!

Happy Clustering!

How to Monitor MongoDB with Prometheus & ClusterControl

$
0
0

SCUMM (Severalnines ClusterControl Unified Monitoring & Management) is an agent-based solution with agents installed on the database nodes. It provides a set of monitoring dashboards, that have Prometheus as the data store with its elastic query language and multi-dimensional data model. Prometheus scrapes metrics data from exporters running on the database hosts.

ClusterControl SCUMM architecture was introduced with version 1.7.0 extending monitoring functionality for MySQL, Galera Cluster, PostgreSQL & ProxySQL.

The new ClusterControl 1.7.1 adds high-resolution monitoring for MongoDB systems.

ClusterControl MongoDB dashboard list

In this article, we will describe the two main dashboards for MongoDB environments. MongoDB Server and MongoDB Replicaset.

Dashboard and Metrics List

The list of dashboards and their metrics:

MongoDB Server 
 Name
ReplSet Name
Server Uptime
OpsCounters
Connections
WT - Concurrent Tickets (Read)
WT - Concurrent Tickets (Write)
WT - Cache
Global Lock
Asserts
ClusterControl MongoDB Server Dashboard
MongoDB ReplicaSet 
 ReplSet Size
ReplSet Name
PRIMARY
Server Version
Replica Sets and Members
Oplog Window per ReplSet
Replication Headroom
Total of PRIMARY/SECONDARY online per ReplSet
Open Cursors per ReplSet
ReplSet - Timed-out Cursors per Set
Max Replication Lag per ReplSet
Oplog Size
OpsCounters
Ping Time to Replica Set Members from PRIMARY(s)
ClusterControl MongoDB ReplicaSet Dashboard

Database systems heavily depend on OS resources, so you can also find two additional dashboards for System Overview and Cluster Overview of your MongoDB environment.

System Overview 
 Server Uptime
CPU Cores
Total RAM
Load Average
CPU Usage
RAM Usage
Disk Space Usage
Network Usage
Disk IOPS
Disk IO Util %
Disk Throughput
ClusterControl System Overview Dashboard
Cluster Overview 
 Load Average 1m
Load Average 5m
Load Average 15m
Memory Available For Applications
Network TX
Network RX
Disk Read IOPS
Disk Write IOPS
Disk Write + Read IOPS
ClusterControl Cluster Overview Dashboard

MongoDB Server Dashboard

ClusterControl MongoDB metrics

Name - Server address and the port.

ReplsSet Name - Presents the name of the replica set where the server belongs to.

Server Uptime - Time since last server restart.

Ops Couters - Number of requests received during the selected time period broken up by the type of the operation. These counts include all received operations, including ones that were not successful.

Connections - This graph shows one of the most important metrics to watch - the number of connections received during the selected time period including unsuccessful requests. Abnormal traffic loads can lead to performance issues. If MongoDB runs low on connections, it may not be able to handle incoming requests in a timely manner.

WT - concurrent Tickets (Read) / WT - concurrent TIckets (Write) These two graphs show read and write tickets which control concurrency in WiredTiger (WT). WT tickets control how many read and write operations can execute on the storage engine at the same time. When available read and write tickets drop to zero, the number of concurrent running operations is equal to the configured read/write values. This means that any other operations must wait until one of the running threads finishes its work on the storage engine before executing.

ClusterControl MongoDB metrics

WT - Cache (Dirty, Evicted - Modified, Evicted - Unmodified, Max) - The size of the cache is the single most important knob for WiredTiger. By default, MongoDB 3.x reserves 50% (60% in 3.2) of the available memory for its data cache.

Global Lock (Client-Read, Client - Write, Current Queue - Reader, Current Queue - Writer) - Poor schema design patterns or heavy read and write requests from many clients may cause extensive locking. When this occurs, there is a need to maintain consistency and avoid write conflicts.
To achieve this MongoDB uses multi-granularity-locking which enables locking operations to happen at different levels, such as a global, database, or collection level.

Asserts (msg, regular, rollovers, user) - This graph shows the number of asserts that are raised each second. High values and deviations from trends should be reviewed.

MongoDB ReplicaSet Dashboard

The metrics that are shown in this dashboard matter only if you use a replica set.

ClusterControl MongoDB ReplicaSet Metrics

ReplicaSet Size - The number of members in the replica set. The standard replica set deployment for the production system is a three-member replica set. Generally speaking, it is recommended that a replica set has an odd number of voting members. Fault tolerance for a replica set is the number of members that can become unavailable and still leave enough members in the set to elect a primary. The fault tolerance for three members is one, for five it is two etc.

ReplSet Name - It is the name assigned in the MongoDB configuration file. The name refers to /etc/mongod.conf replSet value.

PRIMARY - The primary node receives all the write operations and records all other changes to its data set in its operation log. The value is to identify the IP and port of your primary node in the MongoDB replica set cluster.

Server Version - Identify the server version. ClusterControl version 1.7.1 supports MongoDB versions 3.2/3.4/3.6/4.0.

Replica Sets and Members (min, max, avg) - This graph can help you to identify active members over the time period. You can track the minimum, maximum and average numbers of primary and secondary nodes and how these numbers changed over time. Any deviation may affect fault tolerance and cluster availability.

Oplog Window per ReplSet - Replication window is an essential metric to watch. The MongoDB oplog is a single collection that has been limited in a (preset) size. It can be described as the difference between the first and the last timestamp in the oplog.rs. It is the amount of time a secondary can be offline before initial sync is needed to sync the instance. These metrics inform you how much time you have left before our next transaction is dropped from the oplog.

ClusterControl MongoDB ReplicaSet Metrics

Replication Headroom - This graph presents the difference between the primary’s oplog window and the replication lag of the secondary nodes. The MongoDB oplog is limited in size and If the node lags too far, it won’t be able to catch up. If this happens, full sync will be issued and this is an expensive operation that has to be avoided at all times.

Total of PRIMARY/SECONDARY online per ReplSet - Total number of cluster nodes over the time period.

Open Cursors per ReplSet (Pinned, Timeout, Total) - A read request comes with a cursor which is a pointer to the data set of the result. It will remain open on the server and hence consume memory unless it is terminated by the default MongoDB setting. You should be identifying non-active cursors and cut them off to save on memory.

ReplSet - Timeout Cursors per SetsMax Replication Lag per ReplSet - Replication lag is very important to keep an eye on if you are scaling out reads via adding more secondaries. MongoDB will only use these secondaries if they don’t lag too far behind. If the secondary has replication lag, you risk serving out stale data that already has been overwritten on the primary.

OplogSize - Certain workloads might require larger oplog size. Updates to multiple documents at once, deletions equal the same amount of data as an insert or the significant number of in-place updates.

OpsConters - This graph shows the number of queries executions.

Ping Time to Replica Set Member from Primary - This lets you discover replica set members that are down or unreachable from the primary node.

Closing remarks

The new ClusterControl 1.7.1 MongoDB dashboard feature is available in the Community Edition for free. Database ops teams can profit from it by using the high-resolution graphs, especially when performing their daily routines as root cause analyzes and capacity planning.

It’s just a matter of one click to deploy new monitoring agents. ClusterControl installs Prometheus agents, configures metrics and maintains access to Prometheus exporters configuration via its GUI, so you can better manage parameter configuration like collector flags for the exporters (Prometheus).

By adequately monitoring the number of reads and write requests you can prevent resource overload, quickly find the origin of potential overloads, and know when to scale up.

Database Security - How to Use Encryption to Protect Your MongoDB Data

$
0
0

Database security is a key factor to consider for any application that involves highly sensitive data such as financial and health reports. Data protection can be achieved through encryption at different levels starting from the application itself to files holding the data.

Since MongoDB is a non-relational database, one does not need to define columns before inserting data; and therefore documents in the same collection could have different fields from one another.

On the other hand, for SQL DBMS, one has to define columns for the data, hence all the rows have the same columns. One can decide to encrypt individual columns, entire database file or data from the application before being involved in the database process.

Encryption of individual columns is most preferred since it is cheaper and less data is encrypted thus improving on latency. In general, overall performance impacts as a result of the encryption.

For NoSQL DBMS, this approach however will not be the best. Considering that not all documents may have all the fields you want to use in your encryption, column-level encryption cannot be performed.

Encrypting data at application level is quite costly and difficult to implement. We therefore remain with an option of encrypting data at database level.

MongoDB provides native encryption which does not require one to pay an extra cost for securing your sensitive data.

Encrypting Data in MongoDB

Any database operation involves either of these two data forms, data at rest or data in motion.

Data in motion is a stream of data moving through any kind of network whereas data at rest is static hence not moving anywhere.

Both of these wo data types are prone to external interference by anonymous users not unless encryption is involved. The encryption process involves:

  • Generating a master key for the entire database
  • Generating unique keys for each database
  • Encrypting your data with the database keys you generated
  • Encrypting the entire database with the master key

Encrypting Data in Transit

Data is transacted between MongoDB and the server application in two ways that is, through Transport Layer Security (TLS) and Secure Socket Layer (SSL).

These two are the most used encryption protocols for securing sent and received data between two systems. Basically, the concept is to encrypt connections to the mongod and mongos instances such that the network traffic is only readable by the intended client.

TLS/SSL are used in MongoDB with some certificates as PEM files which are issued by the certificate authority or can be a self-signed certificate. The latter has a limitation in that however the communication channel is encrypted, there is always no validation against the server identity hence vulnerable to external attacks midway. It is thus advisable to use trusted authority certificates which permit MongoDB drivers to also verify the server identity.

Besides encryption, TLS/SSL can be used in the authentication of the client and internal auths of members of replica sets and sharded clusters through the certificates.

TLS/SSL Configuration for Clients

There are various TLS/SSL option settings that can be used in the configuration of these protocols.

For example, if you want to connect to a Mongod instance using encryption, you would start your instance like,

mongo --ssl --host example.com --sslCAFile /etc/ssl/ca.pem

--ssl enables the TLS/SSL connection.

--sslCAFile specifies the certificate authority (CA) pem file for verification of the certificate presented by the mongod or the mongos. The Mongo shell will therefore verify the certificate issued by the mongod instance against the specified CA file and the hostname.

You may also want to connect MongoDB instance that requires a client certificate. We use the code sample below

mongo --ssl --host hostname.example.com --sslPEMKeyFile /etc/ssl/client.pem --sslCAFile /etc/ssl/ca.pem

The option --sslPEMKeyFile specifies the .pem file that contains the mongo shell certificate and a key to present to the mongod or mongos instance. During the connection process:

The mongo shell will verify if the certificate is from the specified Certificate Authority that is the (--sslCAFile) and if not, the shell will fail to connect.

Secondly, the shell will also verify if the hostname specified in the --host option matches the SAN/CN in the certificate presented by the mongod or mongos. If this hostname does not match either of the two, then the connection will fail.

If you don’t want to use self-signed certificates, you must ensure the network of connection is trusted.

Besides, you need to reduce the exposure of private key, especially where replica sets/ sharded cluster is involved. This can be achieved by using different certificates on different servers.

Additional options that can be used in the connections are:

requireSSL: this will restrict each server to use only TLS/SSL encrypted connections.

--sslAllowConnectionsWithoutCertificates: This allows validation if only the client presents a certificate otherwise if there is no certificate, the client will still be connected in an encrypted mode. For example:

mongod --sslMode requireSSL --sslAllowConnectionsWithoutCertificates --sslPEMKeyFile /etc/ssl/mongodb.pem --sslCAFile /etc/ssl/ca.pem

sslDisabledProtocols: this option prevents servers from accepting incoming connections that use specific protocols. This can be done with:

mongod --sslMode requireSSL --sslDisabledProtocols TLS1_0,TLS1_1 --sslPEMKeyFile /etc/ssl/mongodb.pem --sslCAFile /etc/ssl/ca.pem

Encrypting Data at Rest

From version 3.2, MongoDB introduced a native encryption option for the WiredTiger storage engine. Access to data in this storage by a third party can only be achieved through a decryption key for decoding the data into a readable format.

The commonly used encryption cipher algorithm in MongoDB is the AES256-GCM. It uses the same secret key to encrypt and decrypt data. Encryption can is turned on using the FIPS mode thus ensuring the encryption meets the highest standard and compliance.

The whole database files are encrypted using the Transparent data encryption (TDE) at the storage level.

Whenever a file is encrypted, a unique private encryption key is generated and is good to understand how these keys are managed and stored. All the database keys generated are thereafter encrypted with a master key.

The difference between the database keys and the master key is that the database keys can be stored alongside the encrypted data itself but for the master key, MongoDB advises it to be stored in a different server from the encrypted data such as third-party enterprise key management solutions.

With replicated data, the encryption criteria are not shared to the other nodes since the data is not natively encrypted over the wire. One can reuse the same key for the nodes but the best practice is to use unique individual keys for every node.

Rotating Encryption Keys

Managed key used for decrypting sensitive data should be rotated or replaced at least once a year. There are two options in MongoDB for achieving the rotation.

KMIP Master Rotation

In this case, only the master key is changed since it is externally managed. The process for rotating the key is as described below.

  1. The master key for the secondary members in the replica set is rotated one at a time. I.e

    mongod --enableEncryption --kmipRotateMasterKey \ --kmipServerName <KMIP Server HostName> \--kmipServerCAFile ca.pem --kmipClientCertificateFile client.pem

    After the process is completed, mongod will exit and you will need to restart the secondary without the kmipRotateMasterKey parameter

    mongod --enableEncryption --kmipServerName <KMIP Server HostName> \
      --kmipServerCAFile ca.pem --kmipClientCertificateFile client.pem
  2. The replica set primary is stepped down:
    Using the rs.stepDown()method, the primary is deactivated hence forcing an election of a new primary.

  3. Check the status of the nodes using the rs.status() method and if the primary indicates to have been stepped down the rotate its master key. Restart the stepped down member including the kmipRotateMasterKey option.

    mongod --enableEncryption --kmipRotateMasterKey \
      --kmipServerName <KMIP Server HostName> \
      --kmipServerCAFile ca.pem --kmipClientCertificateFile client.pem

Logging

MongoDB always works with a log file for recording some status or specified information at different intervals.

However, the log file is not encrypted as part of the storage engine. This poses a risk in that a mongod instance running with logging may output potentially sensitive data to the log files just as part of the normal logging.

From the MongoDB version 3.4, there is the security.redactClientLogData setting which prevents potentially sensitive data from being logged in the mongod process log. However, this option can complicate the log diagnostics.

Severalnines
 
Become a MongoDB DBA - Bringing MongoDB to Production
Learn about what you need to know to deploy, monitor, manage and scale MongoDB

Encryption Performance in MongoDB

Encryption at some point results in increased latency hence degrading the performance of a database. This is usually the case when a large volume of documents is involved.

Encrypting and decrypting require more resources hence is important to understand this relationship in order to adjust capacity planning accordingly.

Regarding the MongoDB tests, an encrypted storage engine will experience a latency of between 10% to 20% at the highest load. This often the case when a user writes a large amount of data to the database hence resulting in reduced performance. For read operations, the performance degradation is negligible, about 5 - 10%.

For a better encryption practice in MongoDB, the WiredTiger storage engine is most preferred due to its high performance, security, and scalability. Further, it optimizes encryption of database files to page level which has great merit in that, if a user reads or writes data to the encrypted database, the throughput operation will only be applied to the page on which the data is stored rather than the entire database.

This will reduce the amount of data that will need to be encrypted and decrypted for processing a single piece of data.

Summary

Data security for sensitive information is a must and there is need to protect it without degrading the performance of the database system.

MongoDB provides a robust native encryption procedures that can help us secure our data both one at rest and that in motion. Besides, the encryption procedures should comply with the set standards by different organizations.

The advanced WiredTiger storage engine provides a better option due to its associated merits such as high performance, scalability, and security. When encrypting data in replica sets, it is a good practice to use different master keys for each besides changing them at least once a year.

However the availability of third-party encryption options, there is no guarantee that your deployment will match alongside them in terms of scalability. It is thus quite considerate to employ database level encryption.

Monitoring & Ops Management of MongoDB 4.0 with ClusterControl

$
0
0

While MongoDB has spent nearly a decade achieving maturity (initial release Feb 2009), the technology is a bit of a mystery to those experienced in conventional relational database (RDBMS) environments. Integrating NoSQL into an existing environment without in-depth knowledge can be challenging. It is not uncommon to see MongoDB running along MySQL or another RDBMS database.

The experience of RDBMS may help to understand some of the processes, but you need to know how to translate your expertise into the NoSQL world. Managing production environments involves steps like deployment, monitoring uptime and performance, maintaining system security, managing HA, backups and so on. Both RDBMS and NoSQL are viable options, but there are specific critical differences between the two that users must keep in mind while implementing or managing MongoDB. Technology changes rapidly and we need to adapt fast.

When MongoDB is suddenly your responsibility, management tools guarantees that the MongoDB databases you manage are stable and secure. Using predefined processes and automation can not only save you time but also protect from the common mistakes. A management platform that systematically addresses all the different aspects of the database lifecycle will be more robust than patching together a number of point solutions.

At the heart of ClusterControl is its automation functionality that lets you automate the database tasks you have to perform regularly, like deploying new databases, adding and scaling new nodes, managing backups, high availability and failover, topology changes, upgrades, and more. ClusterControl provides programmed security, keeping the integrity of your database infrastructure. Moreover, with ClusterControl, MongoDB users are no longer subject to vendor lock-in; something that was questioned by many recently. You can deploy and import a variety of MongoDB versions and vendors from a single console for free. Users of MongoDB often have to use a mixture of tools and homegrown scripts to achieve their requirements, and it's good to know you can find them combined in the one product.

In this article, we will show you how to deploy and manage MongoDB 4.0 in an automated way. You will find here how to do:

  • ClusterControl installation
  • MongoDB deployment process
    • Deploy a new cluster
    • Import existing cluster
  • Scaling MongoDB
    • Read scaling (replicaSet)
    • Write scaling (sharding)
  • Securing MongoDB
  • Monitoring and Trending
  • Backup and Recovery

ClusterControl installation

To start with ClusterControl you need a dedicated virtual machine or host. The VM and supported systems requirements are described here. The base VM can start from 2 GB, 2 cores and Disk space 20 GB storage space, either on-prem or in the cloud.

The installation is well described in the documentation but basically, it comes to download of the installation script which will walk you through the wizard. The wizard script set up the internal database, installs necessary packages, repositories, and do other necessary tweaks. For the internet lock environments, you can use the offline installation process.

ClusterControl requires SSH access to the database hosts, and monitoring can be agent-based or agentless. Management is agentless.

Setup passwordless SSH to all target nodes (ClusterControl and all database hosts) involves running following commands on the ClusterControl server:

$ ssh-keygen -t rsa # press enter on all prompts
$ ssh-copy-id -i ~/.ssh/id_rsa [ClusterControl IP address]
$ ssh-copy-id -i ~/.ssh/id_rsa [Database nodes IP address] # repeat this to all target database nodes

MongoDB Deployment and Scaling

Deploy a New MongoDB 4.0 Cluster

Once we enter the ClusterControl interface, the first thing to do is deploy a new cluster or import an existing one. The new version 1.7.1 introduces support for version 4.0. You can now deploy/import and manage MongoDB v4.0 with support for SSL connections.

Select the option “Deploy Database Cluster” and follow the instructions that appear.

ClusterControl Deploy Database Cluster

When choosing MongoDB, we must specify User, Key or Password and port to connect by SSH to our servers. We also need the name for our new cluster and if we want ClusterControl to install the corresponding software and configurations for us.

After setting up the SSH access information, we must enter the data to access our database. We can also specify which repository to use. Repository configuration is an important aspect for database servers and clusters. You can have three types of the repository when deploying database server/cluster using ClusterControl:

  • Use Vendor Repository
    Provision software by setting up and using the database vendor’s preferred software repository. ClusterControl will install the latest version of what is provided by the database vendor repository.
  • Do Not Setup Vendor Repositories
    Provision software by using the pre-existing software repository already set up on the nodes. The user has to set up the software repository manually on each database node and ClusterControl will use this repository for deployment. This is good if the database nodes are running without internet connections.
  • Use Mirrored Repositories (Create new repository)
    Create and mirror the current database vendor’s repository and then deploy using the local mirrored repository. This allows you to “freeze” the current versions of the software packages.

In the next step, we need to add our servers to the cluster that we are going to create. When adding our servers, we can enter IP or hostname. For the latter, we must have a DNS server or have added our MongoDB servers to the local resolution file (/etc/hosts) of our ClusterControl, so it can resolve the corresponding name that you want to add. For our example, we will deploy a ReplicaSet with three servers, one primary and two secondaries. It is possible to deploy only 2 MongoDB nodes (without arbiter). The caveat of this approach is no automatic failover, since a 2-node setup is vulnerable to split brain. If the primary node goes down then manual failover is required to make the other server as primary. Automatic failover works fine with 3 nodes and more. It is recommended that a replica set has an odd number of voting members. Fault tolerance for a replica set is the number of members that can become unavailable and still leave enough members in the set to elect a primary. The fault tolerance for three members is one, for five it is two etc.

On the same page you can choose from different MongoDB versions:

ClusteControl Deploy MongoDB version 4.0

When all is set hit the deploy button. You can monitor the status of the creation of our new cluster from the ClusterControl activity monitor. Once the task is finished, we can see our cluster in the main ClusterControl screen and on the topology view.

ClusterControl Topology view

As we can see in the image, once we have our cluster created, we can perform several tasks on it, like converting replica set to shard or adding nodes to the cluster.

ClusterControl Scaling

Import a New Cluster

We also have the option to manage an existing cluster by importing it into ClusterControl. Such environment can be created by ClusterControl or other methods like docker installation.

ClusterControl import MongoDB

First, we must enter the SSH access credentials to our servers. Then we enter the access credentials to our database, the server data directory, and the version. We add the nodes by IP or hostname, in the same way as when we deploy, and press on Import. Once the task is finished, we are ready to manage our cluster from ClusterControl.

Scaling MongoDB

One of the cornerstones of MongoDB is that it is built with high availability and scaling in mind. Scaling can be done either vertically by adding more resources to the server or horizontally with more nodes. Horizontal scaling is what MongoDB is good at, and it is not much more than spreading the workload to multiple machines. In effect, we’re making use of multiple low-cost commodity hardware boxes, rather than upgrading to a more expensive high-performance server. MongoDB offers both read- and write scaling, and we will uncover the differences between these two strategies for you. Whether to choose read- or write scaling all depends on the workload of your application: if your application tends to read more often than it writes data you will probably want to make use of the read scaling capabilities of MongoDB.

With ClusterControl adding more servers to the cluster is an easy step. You can do that from the GUI or CLI. For more advanced users you can use ClusterControl Developer Studio and write an resource base condition to expand your cluster horizontally.

MongoDB ReplicaSet
MongoDB ReplicaSet

Sharding

The MongoDB sharding solution is similar to existing sharding frameworks for other major database solutions. It makes use of a typical lookup solution, where the sharding is defined in a shard-key and the ranges are stored inside a configuration database. MongoDB works with three components to find the correct shard for your data. A typical sharded MongoDB environment looks like this:

MongoDB Sharding
MongoDB Sharding

The first component used is the shard router called mongos. All read and write operations must be sent to the shard router, making all shards act as a single database for the client application. The shard router will route the queries to the appropriate shards by consulting the Configserver.

ClusterControl Convert to Shard

Shard management is really easy in MongoDB. You can add and remove shards online and the MongoDB shard router will automatically adjust to what you tell it to. If you wish to know more in-depth about how best to manage shards, please read our blog post about managing MongoDB shards.

Securing MongoDB

MongoDB comes with very little security out of the box: for instance, authentication is disabled by default. In other words: by default, anyone has root rights over any database. One of the changes MongoDB applied to mitigate risks was to change its default binding to 127.0.0.1. This prevents it from being bound to the external IP address, but naturally, this will be reverted by most people who install it. ClusterControl removes human error and provides access to a suite of security features, to automatically protect your databases from hacks and other threats. We previously published a short video with security tips.

The new version of ClusterControl offers SSL support for MongoDB connections. Enabling SSL adds another level of security for communication between the applications (including ClusterControl) and database. MongoDB clients open encrypted connections to the database servers and verify the identity of those servers before transferring any sensitive information.

To enable SSL connection you need to use the latest s9s client. You can install it with

wget http://repo.severalnines.com/s9s-tools/install-s9s-tools.sh
chmod 755 install-s9s-tools.sh
./install-s9s-tools.sh

Or follow other possible installation methods described here.

Once you have s9s tools installed (min version 1.7-93.1) you can use --enable-ssl flag to enable SSL connection.

Example below:

[root@cmon ~]# s9s cluster --cluster-id=3 --enable-ssl --log
This is an RPC V2 job (a job created through RPC V2).
The job owner is 'admin'.
Accessing '/.runtime/jobs/jobExecutor' to execute...
Access ok.
Stopping the cluster
node1:27017: Node is already stopped by the user.
node2:27017: Node is already stopped by the user.
node3:27017: Node is already stopped by the user.
Checking/generating (expire 1000 days) server and CA certificate.
node1:27017: setting up SSL as required way of connection.
Using certificate 'mongodb/cluster_3/server'
node1:27017: installed /etc/ssl/mongodb/cluster_3/server.crt, /etc/ssl/mongodb/cluster_3/server.key and /etc/ssl/mongodb/cluster_3/server_ca.crt
node1:27017: Deploying client certificate 'mongodb/cluster_3/client'
Writing file 'node1:/etc/mongod.conf'.
node1:27017: /etc/mongod.conf [mongod] set: ssl_cert, ssl_key and ssl_ca values.
node2:27017: setting up SSL as required way of connection.
Using certificate 'mongodb/cluster_3/server'
node2:27017: installed /etc/ssl/mongodb/cluster_3/server.crt, /etc/ssl/mongodb/cluster_3/server.key and /etc/ssl/mongodb/cluster_3/server_ca.crt
node2:27017: Deploying client certificate 'mongodb/cluster_3/client'
Writing file 'node2:/etc/mongod.conf'.
node2:27017: /etc/mongod.conf [mongod] set: ssl_cert, ssl_key and ssl_ca values.
node3:27017: setting up SSL as required way of connection.
Using certificate 'mongodb/cluster_3/server'
node3:27017: installed /etc/ssl/mongodb/cluster_3/server.crt, /etc/ssl/mongodb/cluster_3/server.key and /etc/ssl/mongodb/cluster_3/server_ca.crt
node3:27017: Deploying client certificate 'mongodb/cluster_3/client'
Writing file 'node3:/etc/mongod.conf'.
node3:27017: /etc/mongod.conf [mongod] set: ssl_cert, ssl_key and ssl_ca values.
Starting the cluster
node3:27017: Doing some preparation for starting the node.
node3:27017: Disable transparent huge page and its defrag according to mongo suggestions.
node3:27017: Checking file permissions and ownership.
node3:27017: Starting mongod MongoDb server with command:
ulimit -u 32000 -n 32000 &&  runuser -s /bin/bash mongod '-c mongod -f /etc/mongod.conf'
node3:27017: Verifing that 'mongod' process is started.
SSL setup done.

ClusterControl will execute all necessary steps including certification creation on all cluster nodes. Such certificates can be maintained later on in the Key Management tab.

ClusterControl Key Management

Monitoring

When working with database systems, you should be able to monitor them. That will enable you to identify trends, plan for upgrades or improvements or react effectively to any problems or errors that may arise.

ClusterControl MongoDB overview

The new ClusterControl 1.7.1 adds high-resolution monitoring for MongoDB based. It's using Prometheus as the data store with PromQL query language. The list of dashboards includes MongoDB Server, MongoDB ReplicaSet, System Overview, and Cluster Overview Dashboards. ClusterControl installs Prometheus agents, configures metrics and maintains access to Prometheus exporters configuration via its GUI, so you can better manage parameter configuration like collector flags for the exporters (Prometheus). We described in details what can be monitored recently in the article How to Monitor MongoDB with Prometheus & ClusterControl.

ClusterControl MongoDB SCUMM Dashboards

Alerting

As a database operator, we need to be informed whenever something critical occurs on our database. The three main methods in ClusterControl to get an alert includes:

  • email notifications
  • integrations
  • advisors

You can set the email notifications on a user level. Go to Settings > Email Notifications. Where you can choose between criticality and type of alert to be sent.

The next method is to use Integration services. This is to pass the specific category of events to the other service like ServiceNow tickets, Slack, PagerDuty etc. so you can create an advanced notification methods and integrations within your organization.

ClusterControl Integration Services

The last one is to involve sophisticated metrics analysis in Advisor section, where you can build intelligent checks and triggers. An example here could be an disk space usage prediction or cluster scaling by adding nodes when the workload reach preset level.

ClusterControl Advisors for MongoDB

Backup and Recovery

Now that you have your MongoDB replicaSet up and running, and have your monitoring in place, it is time for the next step: ensure you have a backup of your data.

ClusterControl Create Backup Policy

ClusterControl provides an interface for MongoDB backup management with support for scheduling and creative reports. It gives you two options for backup methods.

  • Mongodump
  • Mongodb consistent backup

Mongodump dumps all the data in Binary JSON (BSON) format to the specified location. Mongorestore can later on use the BSON files to restore your database. ClusterControl MongoDB consistent backup includes the transactions from the oplog that were executing while making the backup.

ClusterControl Backup Encryption

A good backup strategy is a critical part of any database management system. ClusterControl offers many options for backups and recovery/restore.

ClusterControl Backup Schedule Control

ClusterControl backup retention is configurable; you can choose to retain your backup for any time period or to never delete backups. AES256 encryption is employed to secure your backups against rogue elements. For rapid recovery, backups can be restored directly into the backup cluster - ClusterControl handles the full restore process from launch to cluster recovery, removing error-prone manual steps from the process.

Operational Factors to Consider During MongoDB Data Modeling

$
0
0

In my previous blog, How to use MongoDB Data Modelling to Improve Throughput Operations, we discussed the 2 major data modelling relationship approaches that is, embedding and referencing. The scalability of MongoDB is quite dependent on its architecture and to be specific, data modelling. When designing a NoSQL DBM, the main point of consideration is to ensure schema-less documents besides a small number of collections for the purpose of easy maintenance. Good data integrity, adopting data validation through some defined rules before storage is encouraged. A database architecture and design should be normalized and decomposed into multiple small collections as a way of shunning data repetition, improve data integrity and make it easy with retrieval patterns. With this in place, you are able to improve data consistency, atomicity, durability and integrity of your database.

Data modelling is not an afterthought undertaking in an application development phase but an initial consideration since many application facets are actually realised during the data modelling stage. In this article we are going to discuss which factors need to be considered during data modelling and see how they affect performance of a database in general.

Many times you will need to deploy a cluster of your database as one way of increasing data availability. With a well designed data model you can distribute activities to a sharded cluster more effectively hence reduce the throughput operations aimed at a single mongod instance. The major factors to consider in data modelling include:

  1. Scalability
  2. Atomicity
  3. Performance and Data usage
  4. Sharding
  5. Indexing
  6. Storage optimization
  7. Document structure and growth
  8. Data Lifecycle

1. Scalability

This is an increase in the workload of an application driven by increased traffic. Many applications always have an expectation in the increase in number of its users. When there are so many users being served by a single database instance, the performance does not always meet the expectations. As a database manager, you thus have a mandate to design this DBM such that collections and data entities are modelled based on the present and future demands of the application. The database structure should generally be presentable to enhance easy the process of replication and sharding. When you have more shards, the write operations are distributed among this shards such that for any data update, it is done within the shard containing that data rather than looking up in a single large set of data to make an update.

2. Atomicity

This refers to the succeeding  or failure of an operation as a single unit. For example you might have a read operation that involves a sort operation after fetching the result. If the sort operation is not handled properly, the whole operation will therefore not proceed to the next stage.

Atomic transactions are series of operations that are neither divisible nor reducible hence occur as single entities or fail as a single operations. MongoDB versions before 4.0 support write operations as atomic processes on a single document level. With the version 4.0, one can now implement multi-document transactions. A data model that enhances atomic operations tends to have a great performance in terms of latency. Latency is simply the duration within which an operation request is sent and when a response is returned from the database. To be seccant, it is easy to update data which is embedded in a single document rather than one which is referenced.

Let’s for example consider the data set below

{
    childId : "535523",
    studentName : "James Karanja",
    parentPhone : 704251068,
    age : 12,
    settings : {
        location : "Embassy",
        address : "420 01",
        bus : "KAZ 450G",
        distance : "4"
      }
}

If we want to update the age by increasing it by 1 and change the location to London we could do:

db.getCollection(‘students’).update({childId: 535523},{$set:{'settings.location':'London'}, $inc:{age:1}}).

If for example the $set operation fails, then automatically the $inc operation will not be implemented and in general the whole operation fails.

On the other hand, let’s consider referenced data suche that there are 2 collections one for student and the other for settings.

Student collection

{
    childId : "535523",
    studentName : "James Karanja",
    parentPhone : 704251068,
    age : 12
}

Settings collection

{
  childId : "535523",  
  location : "Embassy",
  address : "420 01",
  bus : "KAZ 450G",
  distance : "4"
}

In this case you can update the age and location values with separate write operations .i.e

db.getCollection(‘students’).update({childId: 535523},{$inc:{age:1}})
db.getCollection('settings’).update({childId: 535523 } , {$set: { 'settings.location':'London'}})

If one of the operations fails, it does not necessarily affect the other since they are carried out as different entities.

Transactions for Multiple Documents

With MongoDB version 4.0, you can now carry out multiple document transactions for replica sets. This improves the performance since the operations are issued to a number of collections, databases and documents for fast processing. When a transaction has been committed the data is saved whereas if something goes wrong and a transaction fails, the changes that had been made are discarded and the transaction will be generally aborted. There will be no update to the replica sets during the transaction since the operation is only visible outside when the transaction is fully committed.

As much as you can update multiple documents in multiple transactions, it comes with a setback of reduced performance as compared to single document writes. Besides, this approach is only supported for the WiredTiger storage engine hence being a disadvantage for the In-Memory and MMAPv1 storage engines.

3. Performance and Data Usage

Applications are designed differently to meet different purposes. There are some which serve for the current data only like weather news applications. Depending on the structure of an application, one should be able to design a correspondent optimal database to server the required use case. For example, if one develops an application which fetches the most recent data from the database, using a capped collection will be the best option. A capped collection enhances high throughput operation just like a buffer such that when the allocated space is exploited, the oldest documents are overwritten and the documents can be fetched in the order they were inserted. Considering the inserting order retrieval, there will be no need to use indexing and absence of an index overhead will equally improve the write throughput. With a capped collection, the data associated is quite small in that it can be maintained within the RAM for some time. Temporal data in this case is stored in the cache which is quite read than being written into hence making read operation quite fast. However, the capped collection comes with some disadvantages such as, you cannot delete a document unless drop the whole collection, any change to the size of a document will fail the operation and lastly it is not possible to shard a capped collection.

Different facets are integrated in the data modelling of a database depending on the usage needs. As seen report applications will tend to be more read intensive hence the design should be in a way to improve the read throughput.

4. Sharding

Performance through horizontal scaling can be improved by sharding since the read and write workloads are distributed among the cluster members. Deploying a cluster of shards tends to partition the database into multiple small collections with distributed documents depending on some shard key. You should select an appropriate shard key which can prevent query isolation besides increasing the write capacity. A better selection generally involves a field which is present in all the documents within the targeted collection. With sharding, there is increased storage since as the data grows, more shards are established to hold a subset of this cluster.

5. Indexing

Indexing is one of the best approaches for improving the write workload especially where the fields are occuring in all the documents. When doing indexing, one should consider that each index will require 8KB of data space. Further, when the index is active it will consume some disk space and memory hence should be tracked for capacity planning.

Severalnines
 
Become a MongoDB DBA - Bringing MongoDB to Production
Learn about what you need to know to deploy, monitor, manage and scale MongoDB

6. Storage Optimization

Many small documents within a collection will tend to take more space than when you have a few documents with sub-embedded documents. When modelling , one should therefore group the related data before storage. With a few documents, a database operation can be performed with few queries hence reduced random disk access and there will be fewer associated key entries in the corresponding index. Considerations in this case therefore will be: use embedding to have fewer documents which in turn reduce the per document overhead. Use shorter field names if fewer fields are involved in a collection so as not to make document overhead significant. Shorter field names reduce expressiveness .i.e.

{ Lname : "Briston", score : 5.9 }

will save 9 bytes per document rather than using

{ last_name : "Briston", high_score: 5.9 }

Use the _id field explicitly. By default, MongoDB clients add an _id field to each document by assigning a unique 12-byte ObjectId for this field. Besides, the _id field will be indexed. If the documents are pretty small, this scenario will account for a significant amount of space in overall document number. For storage optimization, you are allowed to specify the value for the _id field explicitly when inserting documents into a collection. However, ensure the value is uniquely identified because it serves as a primary key for documents in the collection.

7. Document Structure and Growth

This happens as a result of the push operation where subdocuments are pushed into an array field or when new fields are added to an existing document. Document growth has some setbacks i.e. for a capped collection, if the size is altered then the operation will automatically fail. For a MMAPv1 storage engine, versions before 3.0 will relocate the document on disk if the document size is exceeded. However, later versions as from 3.0, there is a concept of Power of 2 Sized Allocations which reduces the chances of such re-allocations and allow the effective reuse of the freed record space. If you expect your data to be growing, you may want to refactor your data model to use references between data in distinct documents rather than using a denormalized data model.To avoid document growth, you can also consider using a pre-allocation strategy.

8. Data Lifecycle

For an application that uses the recently inserted documents only, consider using a capped collection whose features have been discussed above.

You may also set the Time to Live feature for your collection. This is quite applicable for access tokens in password reset feature for an applications.

Time To Live (TTL)

This is a collection setting that makes it possible for mongod to automatically remove data after a specified duration. By default, this concept is applied for machine generated event data, logs and session information which need to persist for a limited period of time.

Example:

db.log_events.createIndex( { "createdAt": 1 }, { expireAfterSeconds: 3600 } )

We have created an index createdAt and specified some expireAfterSeconds value of 3600 which is 1 hour after time of creation. Now if we insert a document like:

db.log_events.insert( {
   "createdAt": new Date(),
   "logEvent": 2,
   "logMessage": "This message was recorded."
} )

This document will be deleted after 1 hour from the time of insertion.

You can also set a clock specific time when you want the document to be deleted. To do so, first create an index i.e:

db.log_events.createIndex( { "expireAt": 1 }, { expireAfterSeconds: 0 } )

Now we can insert a document and specify the time when it should be deleted.

db.log_events.insert( {
   "expireAt": new Date(December 12, 2018 18:00:00'),
   "logEvent": 2,
   "logMessage": "Success!"
} )

This document will be deleted automatically when expireAt value is older than the number of seconds specified in the expireAfterSeconds, i.e 0 in this case.

Conclusion

Data modelling is a spacious undertaking for any application design in order to improve its database performance. Before inserting data to your db, consider the application needs and which are the best data model patterns you should implement. Besides, important facets of applications cannot be realised until the implementation of a proper data model.

Viewing all 286 articles
Browse latest View live